8 Reliability
Chapter 8 of the Dynamic Learning Maps® (DLM®) Alternate Assessment System 2021–2022 Technical Manual—Instructionally Embedded Model (Dynamic Learning Maps Consortium, 2022) describes the methods used to calculate reliability for the DLM assessment system and provides results at five levels, consistent with the levels of reporting. This chapter provides a high-level summary of the methods used to calculate reliability, along with updated evidence from the 2022–2023 administration year.
For a complete description of the methods used to calculate reliability for DLM assessments, including the psychometric background, see the 2021–2022 Technical Manual—Instructionally Embedded Model (Dynamic Learning Maps Consortium, 2022) and the corresponding peer-reviewed academic journal articles (Thompson et al., 2019, 2023).
8.1 Background Information on Reliability Methods
The reliability methods and evidence presented in this chapter adhere to guidance given in Standards for Educational and Psychological Testing (American Educational Research Association et al., 2014). Where relevant, evidence provided in accordance with specific standards is noted.
Consistent with the levels at which DLM results are reported, this chapter provides reliability evidence at five levels: (1) the classification accuracy of each linkage level within each Essential Element (EE; linkage level reliability), (2) the number of linkage levels mastered within each EE (EE reliability), (3) the number of linkage levels mastered within each conceptual area in ELA and each claim in mathematics (conceptual area or claim reliability), (4) the total number of linkage levels mastered in each subject (subject reliability), and (5) the classification to overall performance level (performance level reliability). As described in the next section, reliability evidence comes from simulated retests in which assessment data are generated for students with the estimated model parameters and student mastery probabilities.
8.2 Methods of Obtaining Reliability Evidence
In creating the simulated retests used to estimate reliability for DLM scores and classifications, we consider the unique design and administration of DLM assessments. Because of the intended flexibility of instructionally embedded assessment, variation exists in the number of items tested across students. Simulated retests are based on a replication of the administration process and use students’ known mastery classifications from the operational assessment. Therefore, students may not receive the same testlets in the simulation as they did during their actual assessment (i.e., different testlets may be assigned from the pool of available testlets). This means that the simulated retest offers a genuine approximation of actual retest assignment for any given student. Simulated retests replicate results of DLM assessments from actual examinees, based on administration procedures specific to the DLM assessments. However, the simulation produces approximate estimates of reliability, which are contingent on the accuracy of the current scoring model. That is, reliability estimates are an upper-bound on the true reliability.
Simulated retests were conducted to collect reliability evidence according to the Standards’ assertion that “the general notion of reliability/precision is defined in terms of consistency over replications of the testing procedure” (American Educational Research Association et al., 2014, p. 35). The reliability evidence reported here supports “interpretation for each intended score use,” as Standard 2.0 recommends (American Educational Research Association et al., 2014, p. 42). The “appropriate evidence of reliability/precision” (American Educational Research Association et al., 2014, p. 42) was collected using a methodology that aligns to the design of the assessment and interpretations of results. The procedures used to collect reliability evidence align with all applicable standards.
8.2.1 Reliability Sampling Procedure
The simulation design used to obtain the reliability estimates uses a resampling design to mirror DLM assessment data. In accordance with Standard 2.1, the sampling design uses the entire set of operational assessment data to generate simulated examinees (American Educational Research Association et al., 2014, p. 42). Using this process guarantees that the simulation takes on characteristics of the DLM operational assessment data that are likely to affect reliability results. For a complete description of the simulated retest methodology, see Thompson et al. (2023). For one simulated examinee, the process is as follows:
Draw with replacement the student record of one student from the operational assessment data (i.e., the combined fall and spring windows). Use the student’s original probability scores for linkage level mastery as the true values for the simulated student data.
Simulate new assessment responses based on administration rules See Chapter 4 of the 2021–2022 Technical Manual—Instructionally Embedded Model (Dynamic Learning Maps Consortium, 2022) for a complete description of administration procedures.. Item responses are simulated for the assigned testlets from calibrated model parameters, Calibrated parameters were treated as true and fixed values for the simulated retests. conditional on the linkage level mastery status determined in Step 1.
Score the simulated item responses using the operational DLM scoring procedure, estimating linkage level mastery or nonmastery for the simulated assessment. See Chapter 7 of the 2021–2022 Technical Manual—Instructionally Embedded Model (Dynamic Learning Maps Consortium, 2022) for more information. All three scoring rules were implemented when scoring the simulated retests to be consistent with the operational scoring procedure.
Calculate the aggregated summaries of linkage level mastery for the simulated retests (i.e., the levels of reporting; EE, conceptual area or claim, subject, and performance level).
Compare the estimated linkage level mastery and aggregated summaries from the simulated retests to the values reported for the drawn student on the operational assessment.
Steps 1 through 5 are then repeated 100,000 times for each grade and subject to create the full simulated retests data set. Figure 8.1 shows the steps of the simulation process as a flow chart.
Figure 8.1: Simulation Process for Creating Reliability Evidence
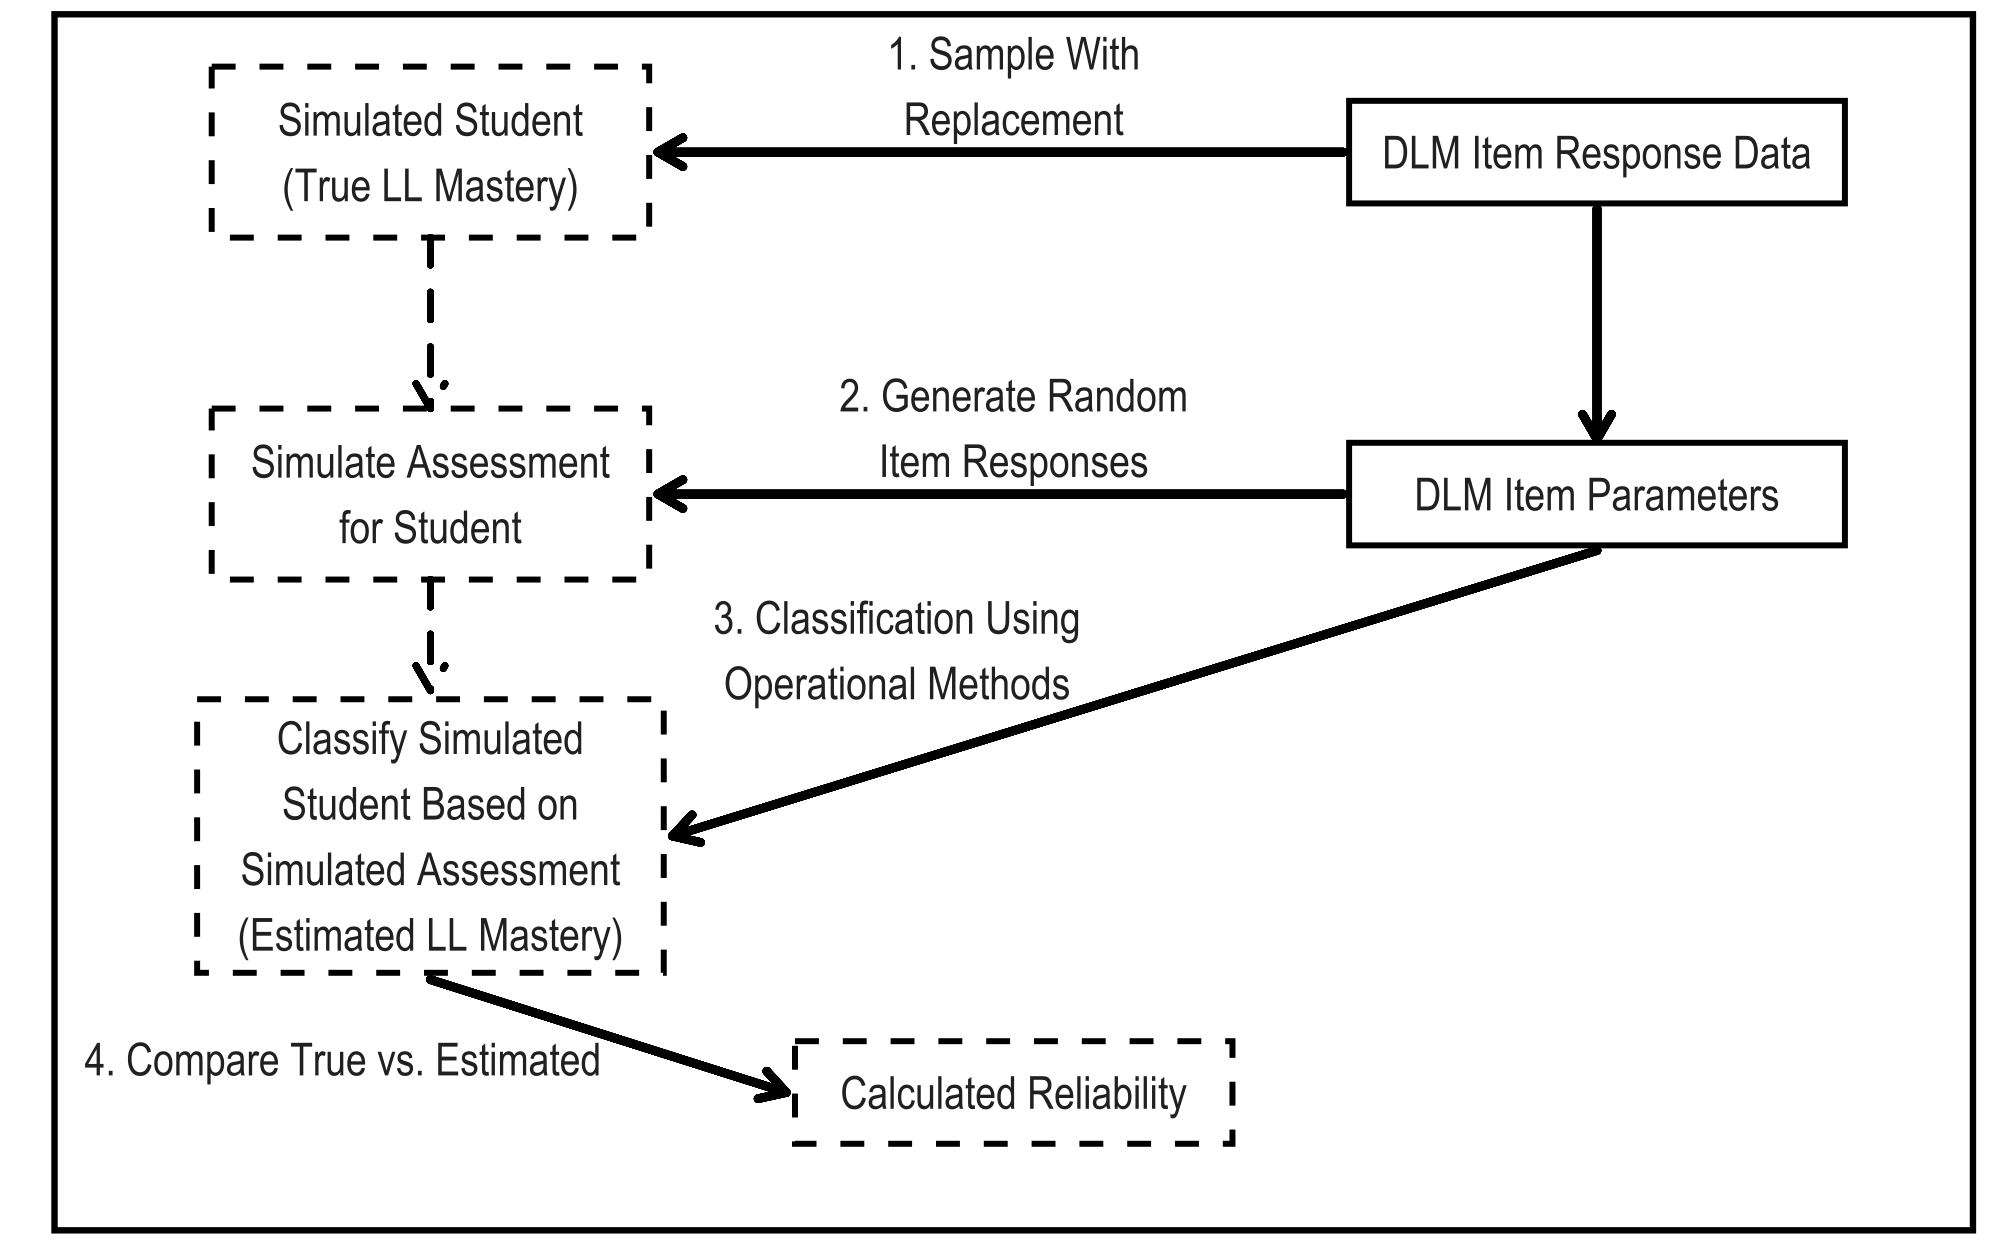
Note. LL = linkage level.
8.3 Reliability Evidence
This chapter provides reliability evidence for five levels of data: (1) linkage level reliability, (2) EE reliability, (3) conceptual area and claim reliability, (4) subject reliability, and (5) performance level reliability, which ensures that the simulation and resulting reliability evidence are aligned with Standard 2.2 (American Educational Research Association et al., 2014, p. 42). Additionally, providing reliability evidence for each of the five levels ensures that these reliability estimation procedures meet Standard 2.5 (American Educational Research Association et al., 2014, p. 43).
Reliability evidence at each level is reported using various correlation coefficients. Correlation estimates mirror estimates of reliability from contemporary measures such as the Guttman-Cronbach alpha. For linkage level and conditional evidence by linkage level reliability, the tetrachoric correlation estimates the relationship between true and estimated linkage level mastery statuses. The tetrachoric correlation is a special case of the polychoric correlation in which the variables are dichotomous. Both the polychoric and tetrachoric correlations provide more useful estimates of relationships between ordinal and discrete variables that would otherwise be attenuated using the standard correlation (i.e., the Pearson coefficient). For EE and performance level reliability, the polychoric correlation estimates the relationship between two ordinal variables: the true performance level or true number of linkage levels mastered and the corresponding estimated value. Finally, for subject and conceptual area or claim reliability, the Pearson correlation estimates the relationship between the true and estimated numbers of linkage levels mastered.
Reliability evidence at each level is also reported using correct classification rates (raw and chance corrected), indicating the proportion of estimated classifications that match true classifications. The chance-corrected classification rate, Cohen’s kappa, represents the proportion of error reduced above chance. Kappa values above .6 indicate substantial-to-perfect agreement between estimated and true values (Landis & Koch, 1977). However, Cohen’s kappa may be limited in this context. Numerous studies have shown that the kappa statistic tends to be too conservative when there are unbalanced categories (Cicchetti & Feinstein, 1990; Feinstein & Cicchetti, 1990; O’Leary et al., 2014; Pontius & Millones, 2011). This is often the case for DLM linkage levels, where the base rate of class membership can be less than .3 or greater than .7. See Chapter 5 of this manual for a summary of base rates of class membership. Thus, it is important to interpret the kappa statistic with caution and within the context of the other reporting metrics.
8.3.1 Linkage Level Reliability Evidence
Evidence at the linkage level comes from comparing the true and estimated mastery status for each of the 1,275 linkage levels in the operational DLM assessment. This level of reliability reporting is the finest grain size of reporting. Although linkage level mastery does not have a directly comparable classical test theory or item response theory analogue, its inclusion is important because it is the level at which mastery classifications are made for DLM assessments. All reported summary statistics of linkage level reliability are based on contingency tables comparing true (operational assessment) and estimated (simulated retest) mastery statuses across all simulated examinees.
In addition to summary statistics from the simulated retests, we also calculate the classification consistency metric, \(\hat{P}_C\), described by Johnson & Sinharay (2018). As the name implies, the classification consistency index is a measure of how consistent the student-level classifications are for each linkage level, and it is calculated from the estimated diagnostic classification model parameters (see Chapter 5 of this manual for a description of the model parameters). The classification consistency metric is based on the estimated model parameters, and thus, it is only applicable to the linkage level, which is the unit of model estimation. See Chapter 5 of the 2021–2022 Technical Manual—Instructionally Embedded Model (Dynamic Learning Maps Consortium, 2022) for a complete description of the model specification. This metric is not based on simulated retests, so it provides a measure of reliability independent from the simulated retests.
For each statistic, figures are given comparing the results of all 1,275 linkage levels. We report linkage level reliability evidence based on three summary statistics from the simulated retests and the nonsimulation-based classification consistency:
- the tetrachoric correlation between estimated and true mastery status,
- the classification agreement for the mastery status of each linkage level,
- the classification consistency (Johnson & Sinharay, 2018), and
- the classification agreement Cohen’s kappa for the mastery status of each linkage level.
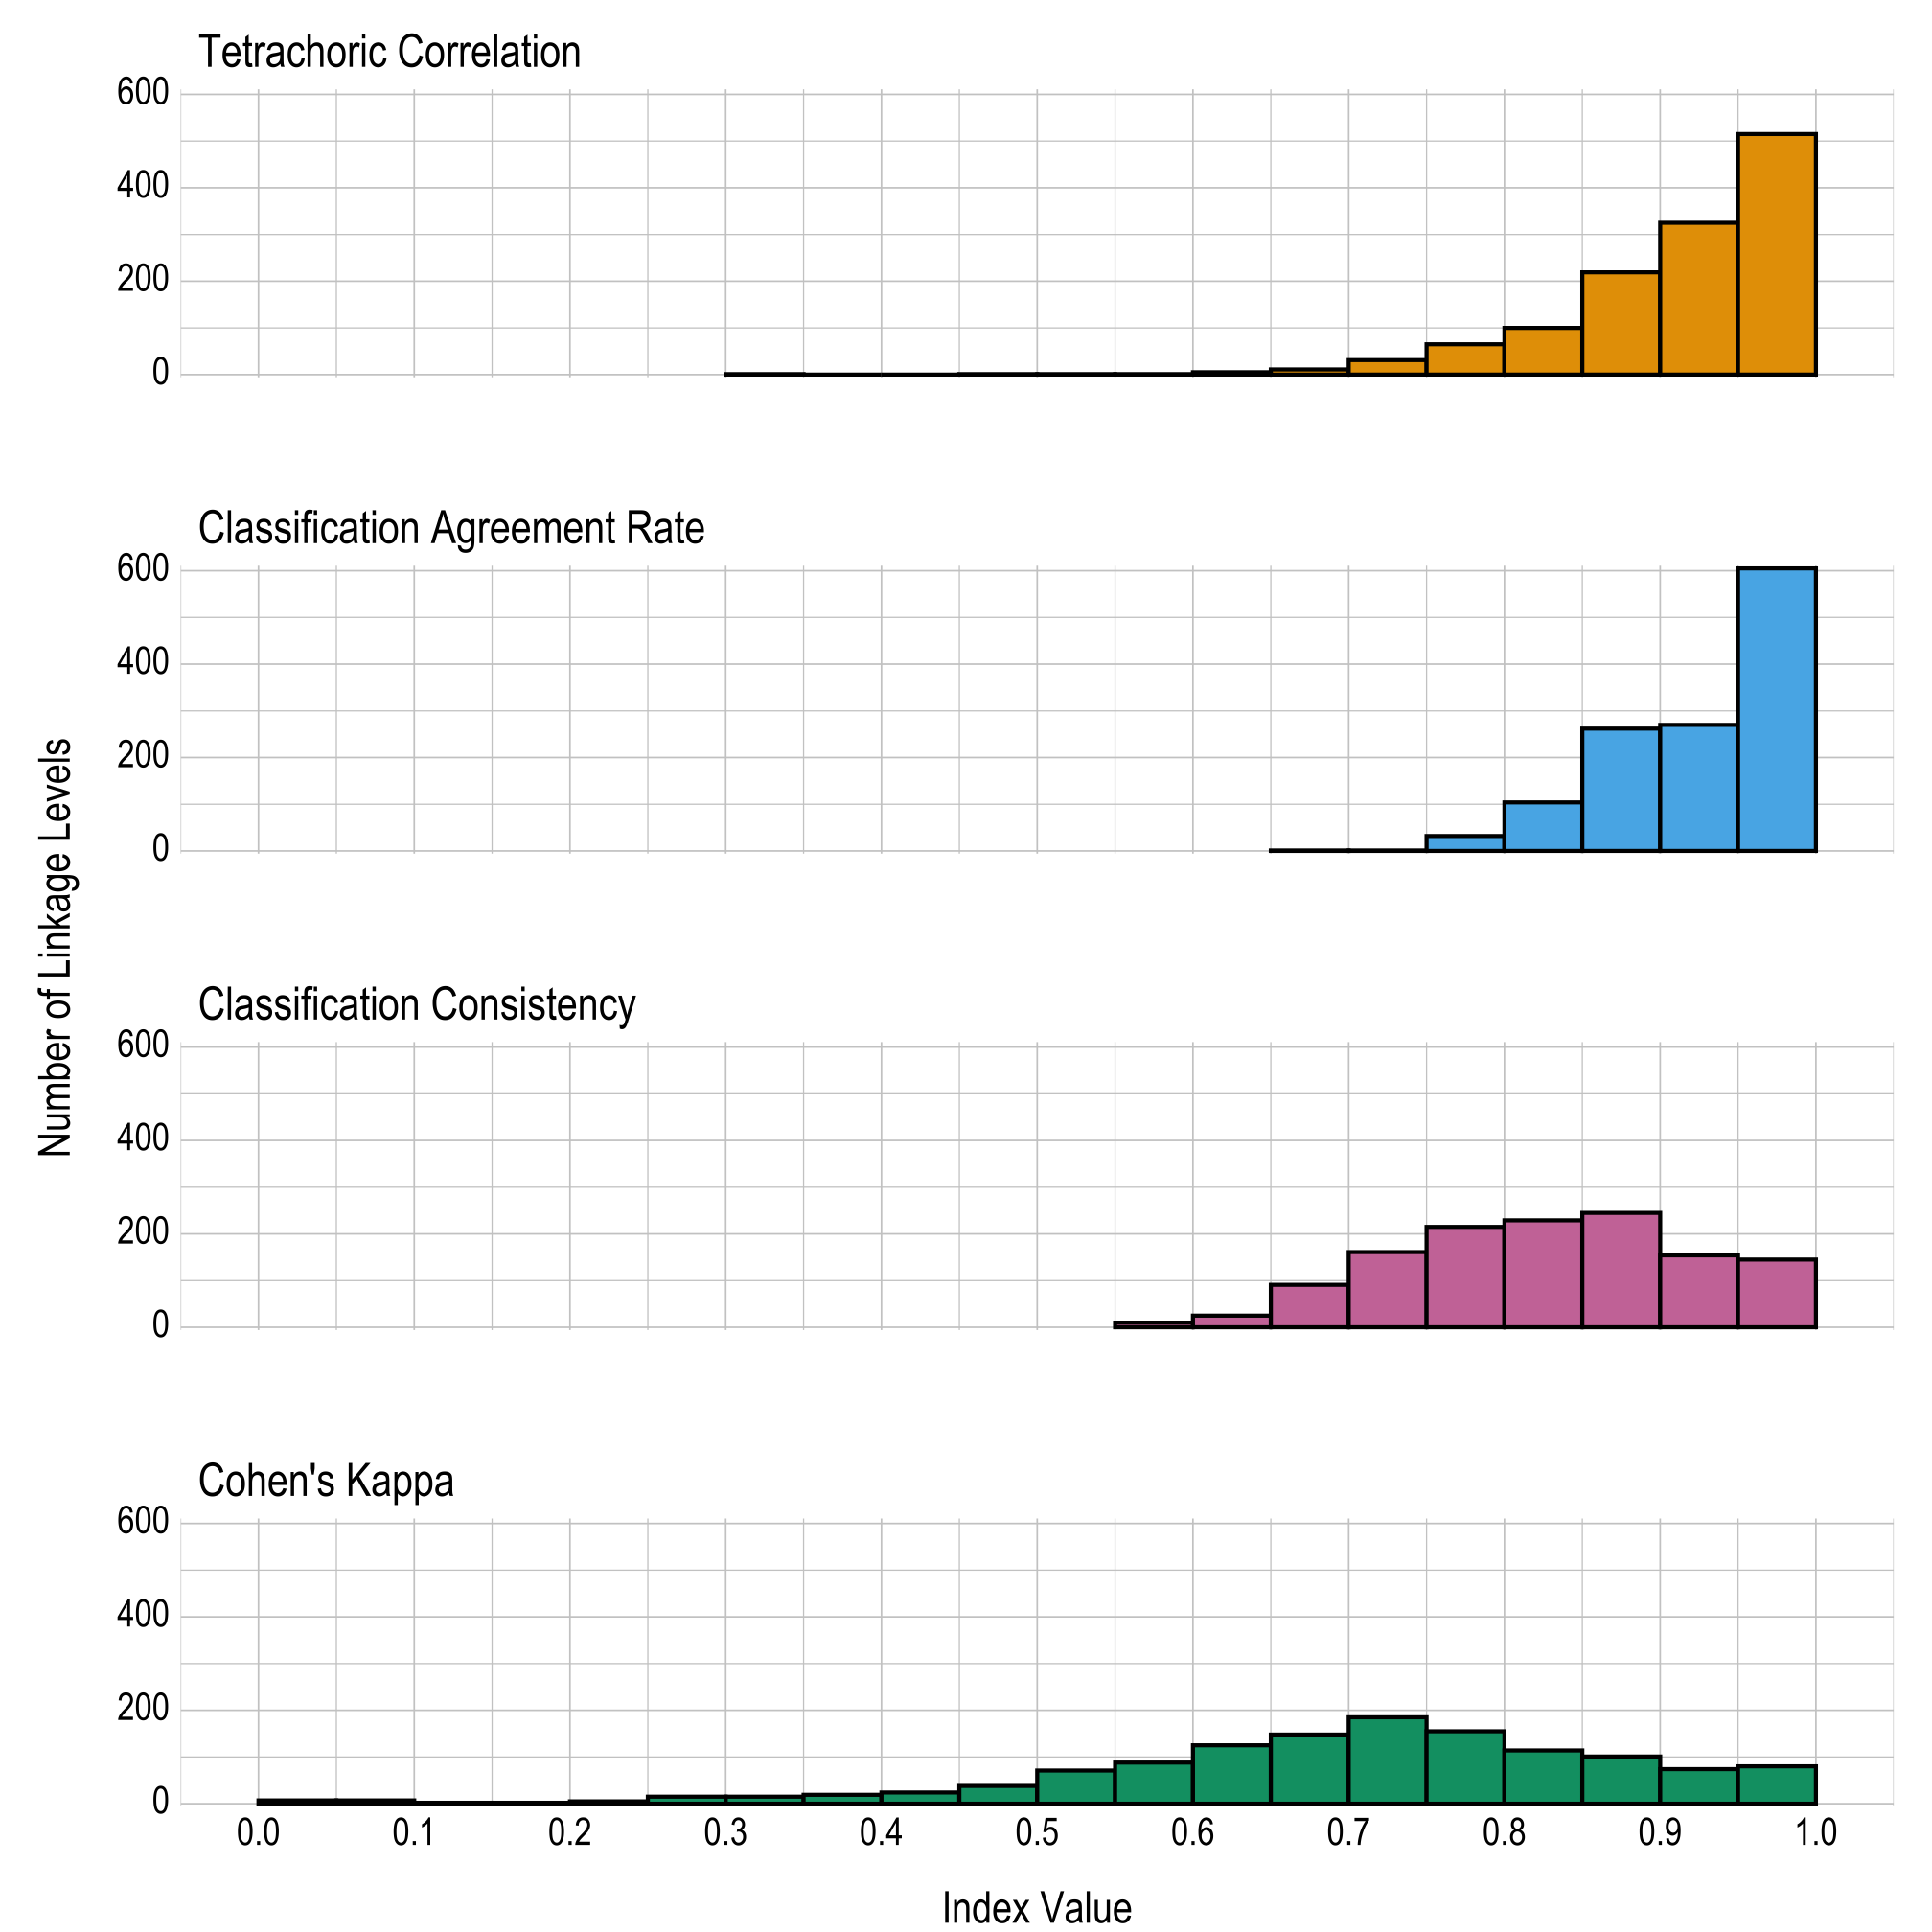
Results are given in both tabular and graphical forms. Table 8.1 and Figure 8.2 provide proportions and the number of linkage levels, respectively, that fall within prespecified ranges of values for the four linkage level reliability summary statistics (i.e., tetrachoric correlation, classification agreement rate, classification consistency, and Cohen’s kappa). Table 8.2 provides the four reliability summary statistics for each linkage level.
The correlations and classification agreement rates show reliability evidence for the classification of mastery at the linkage level. Across all linkage levels, 4 (<1%) had a tetrachoric correlation below .6, 0 (0%) had a classification agreement rate below .6, 10 (1%) had a classification consistency below .6, and 293 (23%) had a Cohen’s kappa below .6. As previously described, Cohen’s kappa may be limited in this context due to unbalanced class categories. Thus, the other three metrics provide a more useful evaluation of linkage level reliability.
Notably, Johnson & Sinharay (2018) recommend a cutoff of .7 for fair classification consistency. Overall, 1,149 (90%) linkage levels meet this cutoff, indicating that the linkage level classifications show a high degree of reliability. For a summary of the closely related classification accuracy, see Chapter 5 of this manual.
|
Index range
|
|||||||||
|---|---|---|---|---|---|---|---|---|---|
| Reliability index | 0.00–0.59 | 0.60–0.64 | 0.65–0.69 | 0.70–0.74 | 0.75–0.79 | 0.80–0.84 | 0.85–0.89 | 0.90–0.94 | 0.95–1.00 |
| Tetrachoric correlation | .003 | .004 | .009 | .024 | .051 | .078 | .172 | .255 | .404 |
| Classification agreement rate | .000 | .000 | <.001 | <.001 | .025 | .082 | .205 | .212 | .475 |
| Classification consistency | .008 | .020 | .071 | .126 | .169 | .180 | .192 | .121 | .114 |
| Cohen’s kappa | .230 | .098 | .116 | .145 | .122 | .089 | .079 | .058 | .063 |
Figure 8.2: Summaries of Linkage Level Reliability
8.3.1.1 Conditional Reliability Evidence by Linkage Level
Traditional assessment programs often report conditional standard errors of measurement to indicate how the precision of measurement differs along the score continuum. The DLM assessment system does not report total or scale score values. Therefore, traditional measures of conditional reliability are not applicable. In particular, standard errors of measurement (inversely related to reliability) that are conditional on a continuous trait are based on the calculation of Fisher’s information, which involves taking the second derivative-model likelihood function with respect to the latent trait. When classifications are the latent traits, however, the likelihood is not a smooth function regarding levels of the trait and therefore cannot be differentiated (Henson & Douglas, 2005; Templin & Bradshaw, 2013). In other words, because diagnostic classification modeling does not produce a total score or scale score, traditional methods of calculating conditional standard errors of measurement are not appropriate. However, because DLM assessments were designed to span the continuum of students’ varying knowledge, skills, and understandings as defined by the five linkage levels, evidence of reliability can be summarized for each linkage level to approximate conditional evidence over all EEs, similar to a conditional standard error of measurement for a total score.
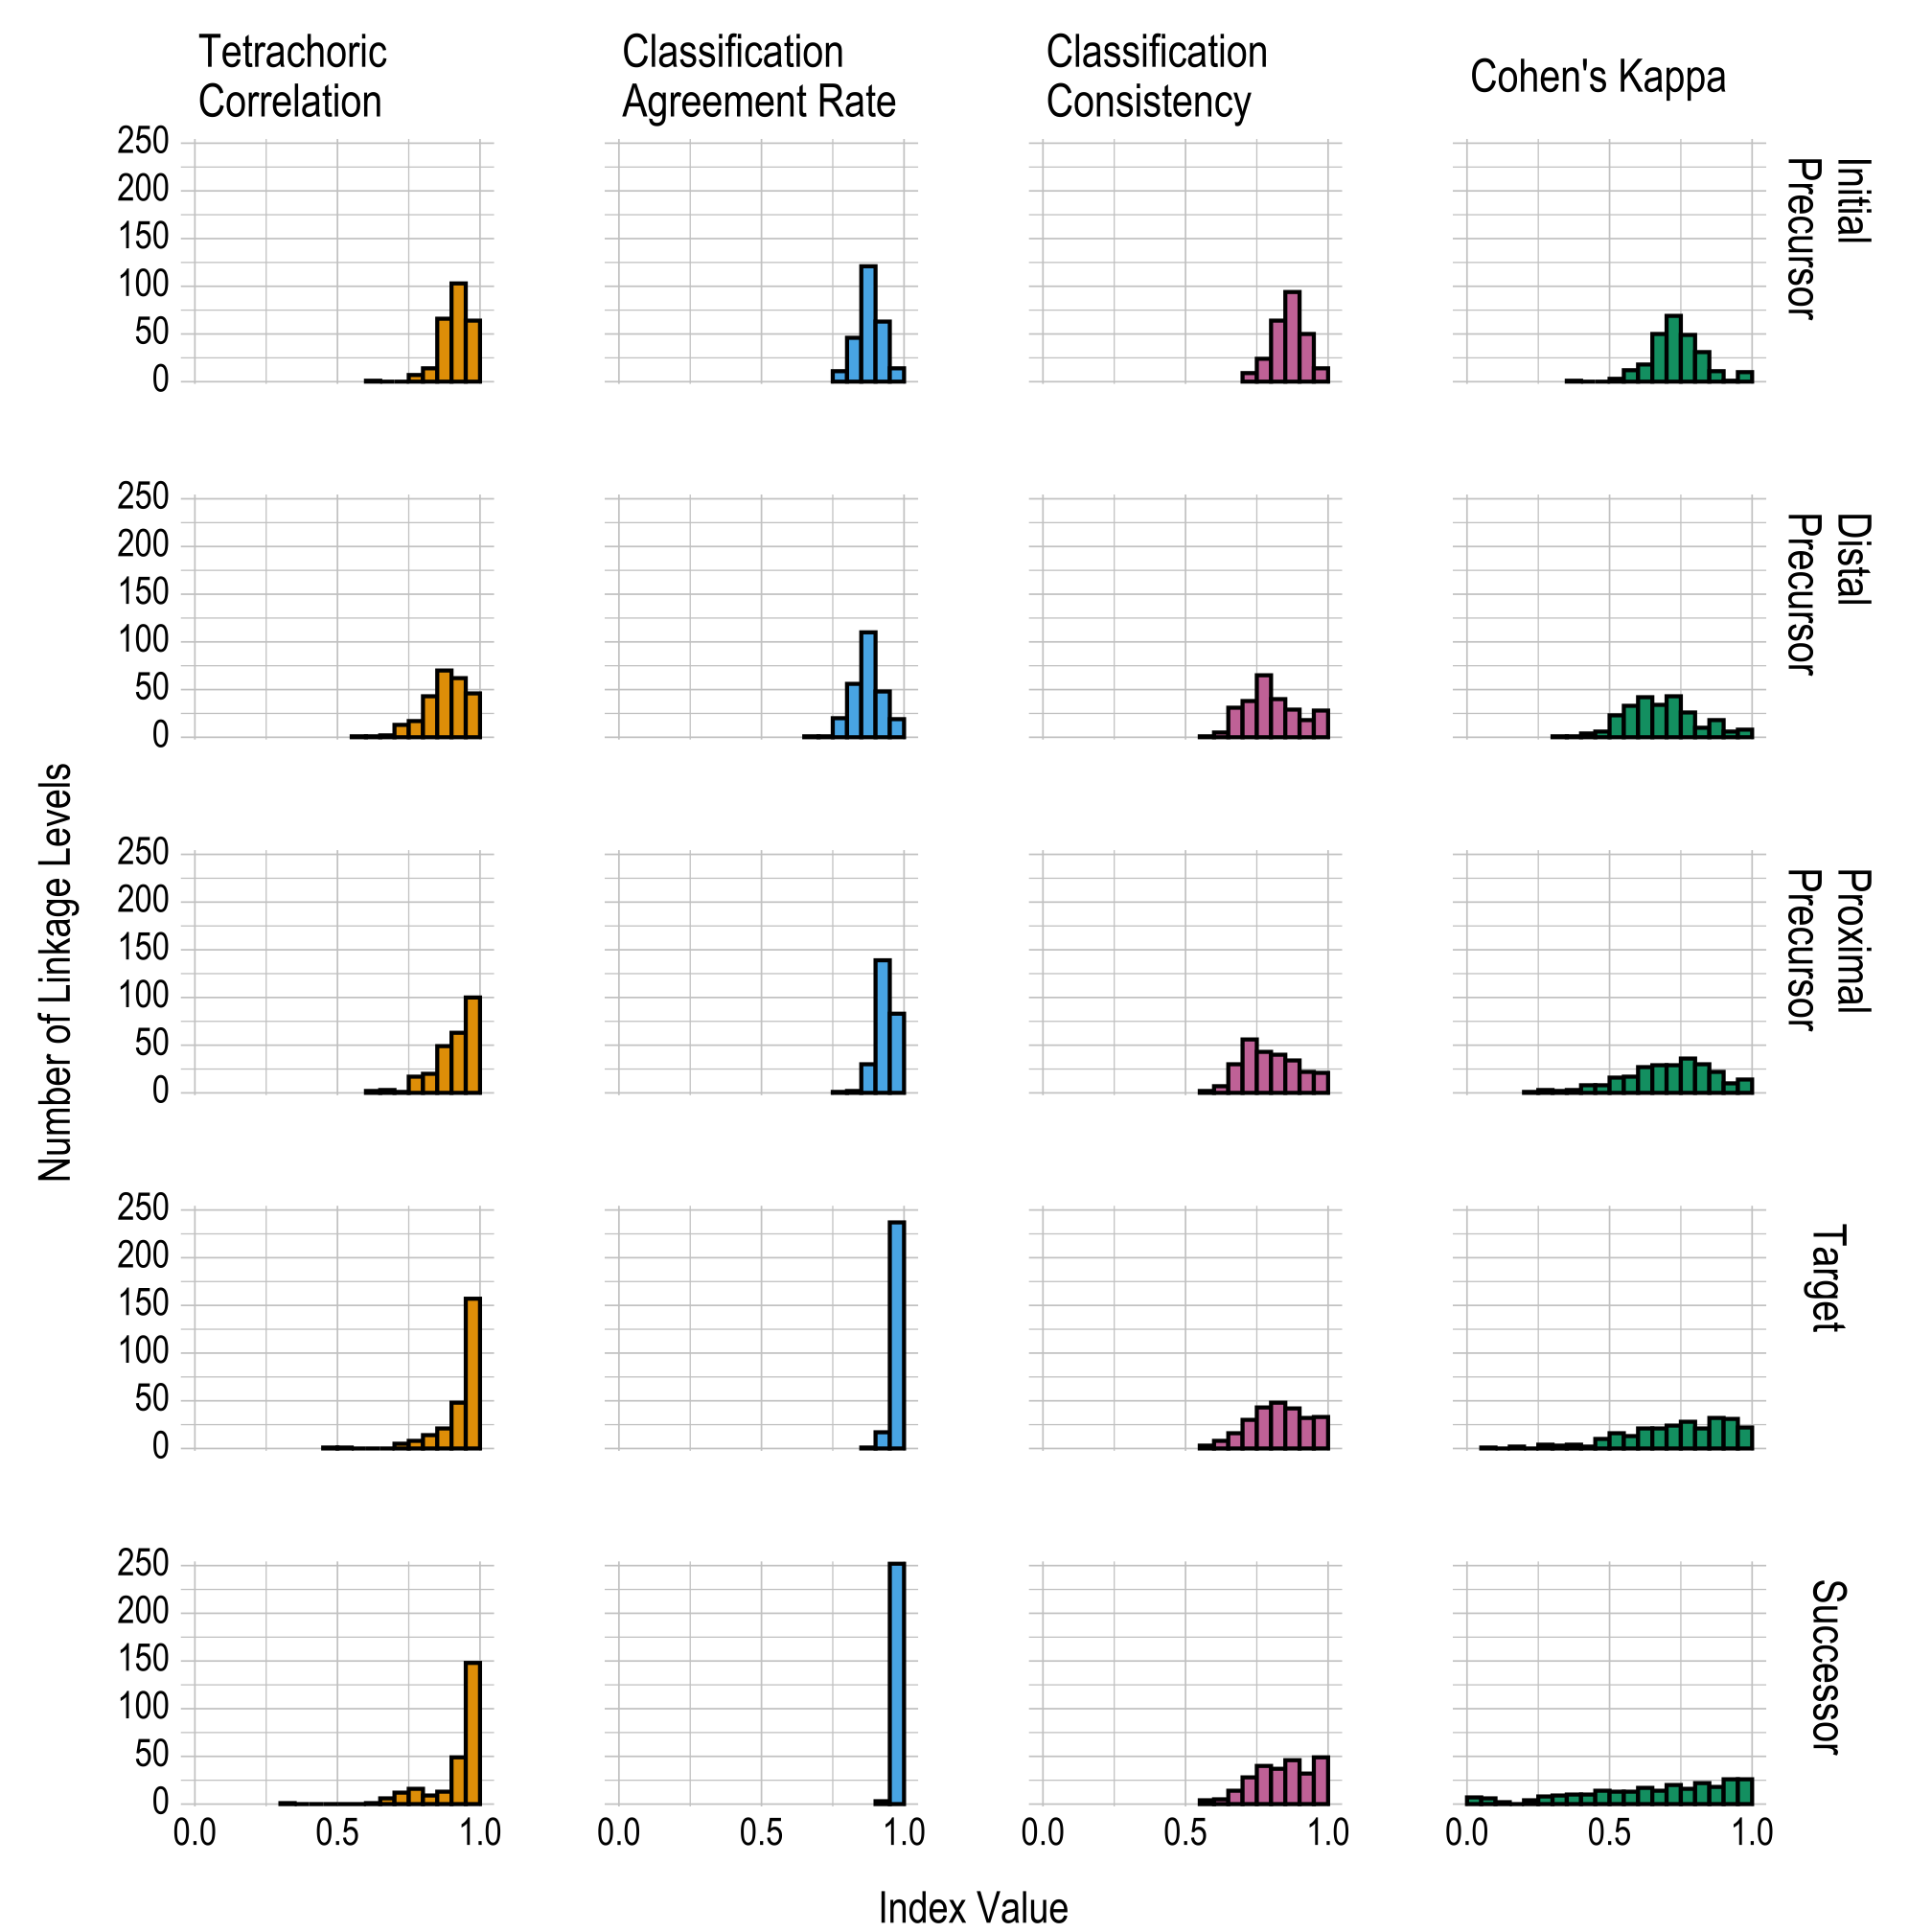
Conditional reliability evidence by linkage level is based on the true and estimated mastery statuses for each linkage level, as summarized by each of the five levels. Results are reported using the same four statistics used to summarize the overall linkage level reliability evidence (i.e., tetrachoric correlation, classification agreement rate, classification consistency, and Cohen’s kappa).
Table 8.3 and Figure 8.3 provide the proportions and the number of linkage levels, respectively, that fall within prespecified ranges of values for each linkage level for the four reliability summary statistics (i.e., tetrachoric correlation, classification agreement rate, classification consistency, and Cohen’s kappa). The correlations and classification agreement rates generally indicate that all five linkage levels provide reliable classifications of student mastery; results are fairly consistent across all linkage levels for each of the four statistics reported. Table 8.2 in the previous section provides the four reliability summary statistics for each individual linkage level.
|
Index range
|
|||||||||
|---|---|---|---|---|---|---|---|---|---|
| Reliability index | 0.00–0.59 | 0.60–0.64 | 0.65–0.69 | 0.70–0.74 | 0.75–0.79 | 0.80–0.84 | 0.85–0.89 | 0.90–0.94 | 0.95–1.00 |
| Initial Precursor | |||||||||
| Tetrachoric correlation | .000 | .004 | .000 | .000 | .027 | .055 | .259 | .404 | .251 |
| Classification agreement rate | .000 | .000 | .000 | .000 | .043 | .180 | .475 | .247 | .055 |
| Classification consistency | .000 | .000 | .000 | .035 | .094 | .251 | .369 | .196 | .055 |
| Cohen’s kappa | .063 | .071 | .196 | .271 | .192 | .122 | .043 | .004 | .039 |
| Distal Precursor | |||||||||
| Tetrachoric correlation | .004 | .004 | .008 | .051 | .067 | .169 | .275 | .243 | .180 |
| Classification agreement rate | .000 | .000 | .004 | .004 | .078 | .220 | .431 | .188 | .075 |
| Classification consistency | .004 | .020 | .122 | .149 | .255 | .157 | .114 | .071 | .110 |
| Cohen’s kappa | .267 | .165 | .133 | .169 | .102 | .039 | .071 | .024 | .031 |
| Proximal Precursor | |||||||||
| Tetrachoric correlation | .000 | .008 | .012 | .004 | .067 | .078 | .192 | .247 | .392 |
| Classification agreement rate | .000 | .000 | .000 | .000 | .004 | .008 | .118 | .545 | .325 |
| Classification consistency | .008 | .027 | .118 | .220 | .169 | .157 | .133 | .086 | .082 |
| Cohen’s kappa | .227 | .106 | .114 | .114 | .141 | .118 | .086 | .039 | .055 |
| Target | |||||||||
| Tetrachoric correlation | .008 | .000 | .000 | .020 | .031 | .055 | .082 | .188 | .616 |
| Classification agreement rate | .000 | .000 | .000 | .000 | .000 | .000 | .004 | .067 | .929 |
| Classification consistency | .012 | .031 | .063 | .118 | .169 | .188 | .165 | .125 | .129 |
| Cohen’s kappa | .216 | .082 | .082 | .094 | .110 | .082 | .125 | .122 | .086 |
| Successor | |||||||||
| Tetrachoric correlation | .004 | .004 | .024 | .047 | .063 | .035 | .051 | .192 | .580 |
| Classification agreement rate | .000 | .000 | .000 | .000 | .000 | .000 | .000 | .012 | .988 |
| Classification consistency | .016 | .020 | .055 | .110 | .157 | .145 | .180 | .125 | .192 |
| Cohen’s kappa | .376 | .067 | .055 | .078 | .063 | .086 | .071 | .102 | .102 |
Figure 8.3: Conditional Linkage Level Reliability Evidence Summarized by Linkage Level
8.3.2 Essential Element Reliability Evidence
The first level of linkage level aggregation is the EE. The EE-level results are reported as the highest linkage level mastered for each EE. Because EE-level results are an aggregation of the individual linkage level classifications, more traditional measures of reliability (e.g., the classification consistency used for linkage levels) are not possible. Therefore, reliability results are only reported based on the simulated retests, which do offer a method for evaluating the reliability of aggregated classifications (Thompson et al., 2019).
Three statistics are used to summarize reliability evidence for EEs:
- the polychoric correlation between true and estimated numbers of linkage levels mastered within an EE,
- the classification agreement rate for the number of linkage levels mastered within an EE, and
- the classification agreement Cohen’s kappa for the number of linkage levels mastered within an EE.
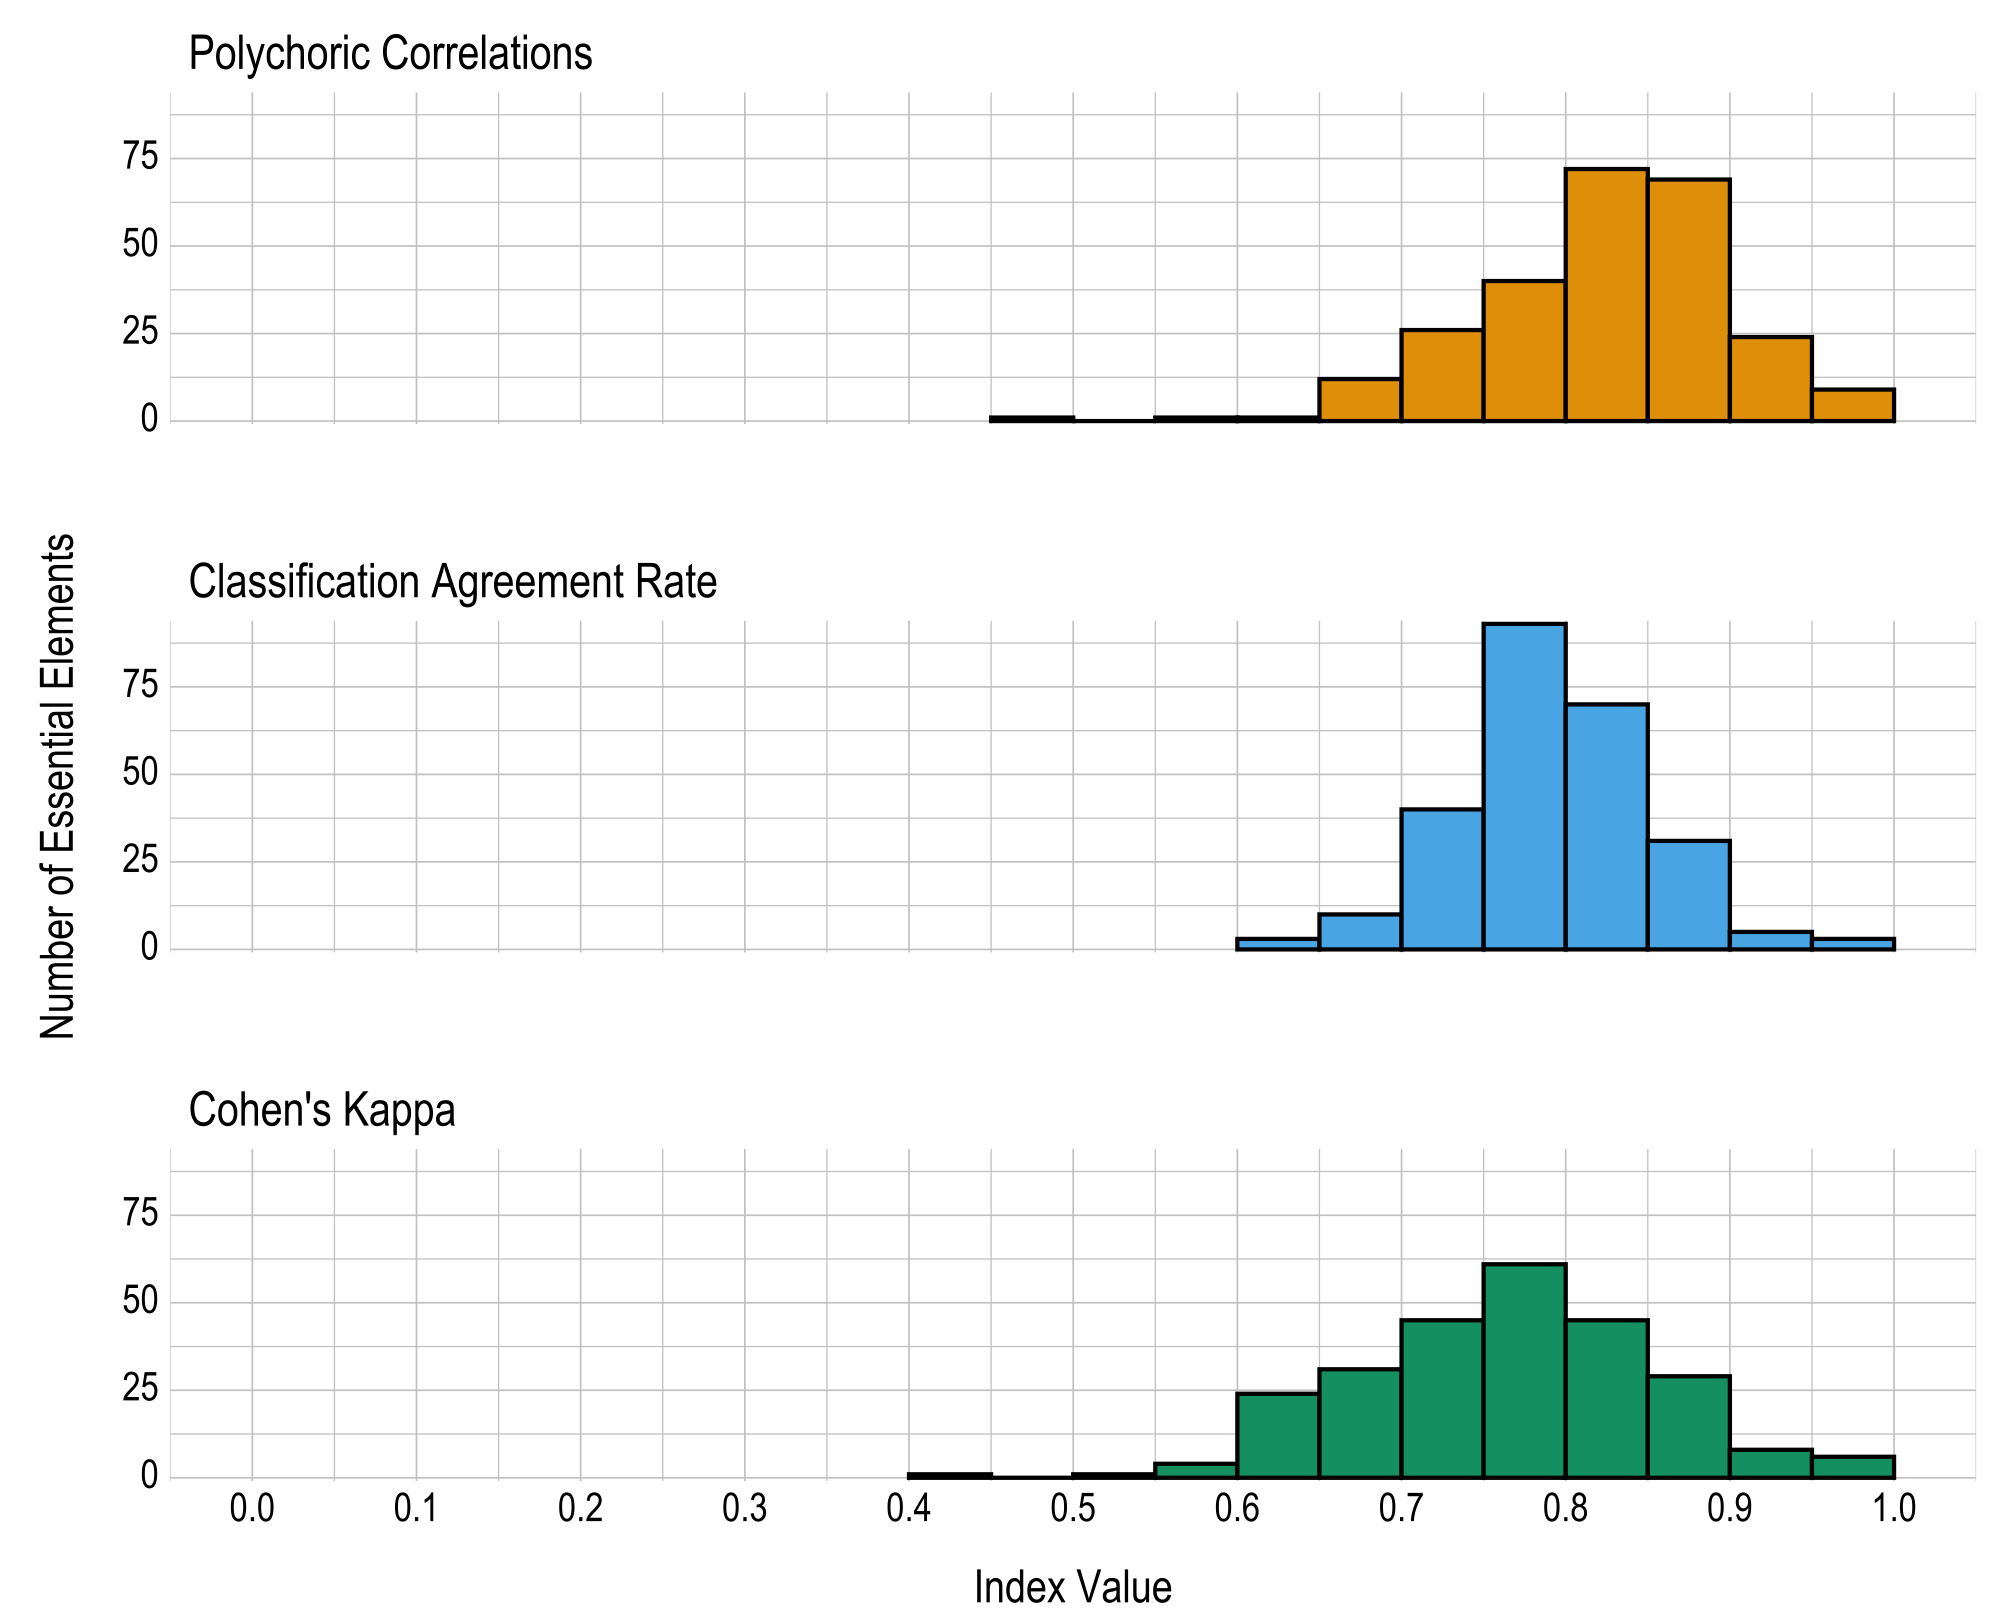
Results are given in both tabular and graphical forms. Table 8.4 and Figure 8.4 provide the proportions and the number of EEs, respectively, falling within prespecified ranges of values for the three reliability summary statistics (i.e., classification agreement rate, kappa, correlation). Across all EEs, 2 (1%) had a polychoric correlation below .6, 0 (0%) had a classification agreement rate below .6, and 6 (2%) had a Cohen’s kappa below .6. In general, the reliability summaries provide strong evidence of reliability for the number of linkage levels mastered within EEs. Table 8.5 provides the three reliability summary statistics for each EE.
|
Index range
|
|||||||||
|---|---|---|---|---|---|---|---|---|---|
| Reliability index | 0.00–0.59 | 0.60–0.64 | 0.65–0.69 | 0.70–0.74 | 0.75–0.79 | 0.80–0.84 | 0.85–0.89 | 0.90–0.94 | 0.95–1.00 |
| Polychoric correlation | .008 | .004 | .047 | .102 | .157 | .282 | .271 | .094 | .035 |
| Classification agreement rate | .000 | .012 | .039 | .157 | .365 | .275 | .122 | .020 | .012 |
| Cohen’s kappa | .024 | .094 | .122 | .176 | .239 | .176 | .114 | .031 | .024 |
Figure 8.4: Number of Linkage Levels Mastered Within Essential Element Reliability Summaries
8.3.3 Conceptual Area and Claim Reliability Evidence
ELA and mathematics EEs are organized into conceptual areas and claims, which are akin to content strands for other assessments. These collections of related EEs describe the overarching sections of the learning map that are the foundation of the DLM assessments. For more information, see Chapter 2 of the 2021–2022 Technical Manual—Instructionally Embedded Model (Dynamic Learning Maps Consortium, 2022). The strands used for reporting are the conceptual area in ELA and the claim in mathematics. Because Individual Student Score Reports summarize the number and percentage of linkage levels students mastered in each conceptual area in ELA and claim in mathematics, For more information, see Chapter 7 of the 2021–2022 Technical Manual—Instructionally Embedded Model (Dynamic Learning Maps Consortium, 2022). we also provide reliability evidence at these levels in their respective subjects, in accordance with Standard 2.2, which indicates that reliability evidence should be provided consistent with the level(s) of scoring (American Educational Research Association et al., 2014, p. 42).
Reliability at the conceptual area or claim level provides consistency evidence for the number of linkage levels mastered across all EEs in each conceptual area for each grade in ELA and each claim in mathematics. Conceptual area and claim reliability evidence compares the true and estimated number of linkage levels mastered across all tested levels for each conceptual area and claim, respectively. Reliability is reported with three summary statistics:
- the Pearson correlation between the true and estimated number of linkage levels mastered within a conceptual area in ELA and claim in mathematics,
- the classification agreement rate for which linkage levels were mastered as averaged across all simulated students for each conceptual area in ELA and claim in mathematics, and
- the classification agreement Cohen’s kappa for which linkage levels were mastered, as averaged across all simulated students for each conceptual area in ELA and claim in mathematics.
Table 8.6 shows the three summary statistics for each conceptual area in ELA and claim in mathematics. Classification rate information is provided in accordance with Standard 2.16 (American Educational Research Association et al., 2014, p. 46). The correlation and Cohen’s kappa summary statistics included in Table 8.6 also align with Standard 2.19 (American Educational Research Association et al., 2014, p. 47). The correlations range from .690 to .970 in ELA and from .623 to .948 in mathematics, the average classification agreement rates range from .976 to .998 in ELA and from .983 to .998 in mathematics, and the average Cohen’s kappa values range from .936 to .998 in ELA and from .948 to .998 in mathematics. These summary statistics indicate that, overall, the conceptual area and claim results provided on score reports are reliable.
8.3.4 Subject Reliability Evidence
The next level of aggregation of linkage level mastery is for the subject overall. Subject reliability provides consistency evidence for the number of linkage levels mastered across all EEs for a given grade and subject. Because students are assessed on multiple linkage levels across the assessed EEs in each subject, subject reliability evidence is similar to reliability evidence for testing programs that use summative assessments to describe overall performance in a subject. That is, the number of linkage levels mastered within a subject is analogous to the number of items answered correctly (i.e., total score) in a different type of testing program.
Subject reliability evidence compares the true and estimated number of linkage levels mastered across all tested levels for a given subject. Because subject-level reporting summarizes the total number of linkage levels a student mastered, the statistics reported for subject reliability are the same as those reported for conceptual area and claim reliability. Reliability is reported with three summary statistics:
- the Pearson correlation between the true and estimated number of linkage levels mastered within a subject,
- the classification agreement rate for which linkage levels were mastered, as averaged across all simulated students, and
- the classification agreement Cohen’s kappa for which linkage levels were mastered, as averaged across all simulated students.
Table 8.7 shows the three summary statistics for each grade and subject. The correlation between true and estimated number of linkage levels mastered ranges from .912 to .971. Students’ average classification agreement rates range from .955 to .987, and average Cohen’s kappa values range from .852 to .965. These values indicate that the total linkage levels mastered in a subject are reliably determined.
| Grade | Linkage levels mastered correlation | Average student classification agreement | Average student Cohen’s kappa |
|---|---|---|---|
| English language arts | |||
| 3 | .955 | .961 | .873 |
| 4 | .971 | .968 | .909 |
| 5 | .962 | .961 | .885 |
| 6 | .962 | .966 | .892 |
| 7 | .963 | .955 | .852 |
| 8 | .956 | .960 | .867 |
| 9 | .966 | .973 | .912 |
| 10 | .967 | .971 | .909 |
| 11 | .957 | .959 | .867 |
| 12 | .958 | .966 | .899 |
| Mathematics | |||
| 3 | .925 | .977 | .910 |
| 4 | .951 | .970 | .875 |
| 5 | .948 | .968 | .875 |
| 6 | .913 | .978 | .910 |
| 7 | .951 | .973 | .909 |
| 8 | .950 | .974 | .899 |
| 9 | .954 | .981 | .940 |
| 10 | .912 | .979 | .929 |
| 11 | .922 | .987 | .965 |
8.3.5 Performance Level Reliability Evidence
The final level of linkage level mastery aggregation is at the overall performance level. Results for DLM assessments are reported using four performance levels. The scoring procedure sums the linkage levels mastered across all EEs in each subject, and cut points are applied to distinguish between the four performance categories. See Chapter 6 of the 2021–2022 Technical Manual—Instructionally Embedded Model (Dynamic Learning Maps Consortium, 2022) for details on the standard setting procedure to determine the cut points.
Performance level reliability provides evidence for how reliably students are classified to the four performance levels for each subject and grade level. Because the performance level is determined by the total number of linkage levels mastered, large fluctuations in the number of linkage levels mastered, or fluctuation around the cut points, could affect how reliably students are assigned into performance categories. The performance level reliability evidence is based on the observed and estimated performance levels from the simulated retests (i.e., based on the estimated total number of linkage levels mastered and predetermined cut points). Three statistics are included to provide a comprehensive summary of results:
- the polychoric correlation between the true and estimated performance levels within a grade and subject,
- the classification agreement rate between the true and estimated performance levels within a grade and subject, and
- the classification agreement Cohen’s kappa between the true and estimated performance levels within a grade and subject.
Table 8.8 presents this information across all grades and subjects. Polychoric correlations between true and estimated performance levels range from .930 to .976. Classification agreement rates range from .807 to .879, and Cohen’s kappa values are between .795 and .912. These results indicate that the DLM scoring procedure of reporting performance levels based on total linkage levels mastered results in reliable classification of students to performance level categories.
| Grade | Polychoric correlation | Classification agreement rate | Cohen’s kappa |
|---|---|---|---|
| English language arts | |||
| 3 | .963 | .811 | .896 |
| 4 | .976 | .848 | .912 |
| 5 | .964 | .812 | .888 |
| 6 | .966 | .827 | .885 |
| 7 | .971 | .836 | .897 |
| 8 | .957 | .829 | .878 |
| 9 | .965 | .879 | .882 |
| 10 | .964 | .864 | .880 |
| 11 | .959 | .843 | .874 |
| 12 | .961 | .826 | .871 |
| Mathematics | |||
| 3 | .942 | .837 | .826 |
| 4 | .960 | .835 | .873 |
| 5 | .958 | .828 | .867 |
| 6 | .930 | .844 | .795 |
| 7 | .958 | .858 | .869 |
| 8 | .957 | .841 | .855 |
| 9 | .965 | .837 | .892 |
| 10 | .935 | .807 | .814 |
| 11 | .937 | .844 | .808 |
8.4 Conclusion
In summary, reliability measures for the DLM assessment system address the standards set forth by American Educational Research Association et al. (2014). The methods are consistent with assumptions of diagnostic classification modeling and yield evidence to support the argument for internal consistency of the program for each level of reporting. The results indicate high levels of reliability for the individual linkage level mastery classifications, as well as for all levels of aggregation for which results are reported (i.e., EE, conceptual area and claim, subject, and overall performance level). Because the reliability results depend on the model used to calibrate and score the assessment, any changes to the model or evidence obtained when evaluating model fit also affect reliability results. As with any selected methodology for evaluating reliability, the current results assume that the model and model parameters used to score DLM assessments are correct. However, unlike other traditional measures of reliability that often require unrealistic assumptions about equivalent test forms, the simulation method described in this chapter provides a replication of the same test administration process used in the operational assessment, which provides a rigorous evaluation of the variation in student results across simulated repeated assessment administrations.