3 Assessment Design and Development
Chapter 3 of the Dynamic Learning Maps® (DLM®) Alternate Assessment System 2021–2022 Technical Manual—Instructionally Embedded Model (Dynamic Learning Maps Consortium, 2022) describes assessment design and development procedures. This chapter provides an overview of updates to assessment design and development for 2022–2023. The chapter first describes the design of English language arts (ELA) reading and writing testlets, as well as mathematics testlets. The chapter then provides an overview of 2022–2023 item writers’ characteristics, followed by the 2022–2023 development of ELA texts and the 2022–2023 external review of items, testlets, and texts based on criteria for content, bias, and accessibility. The chapter concludes by presenting evidence of item quality, including a summary of field-test data analysis and associated reviews, a summary of the pool of operational testlets available for administration, and an evaluation of differential item functioning (DIF).
3.1 Assessment Structure
The DLM Alternate Assessment System uses learning maps as the basis for assessment, which are highly connected representations of how academic skills are acquired as reflected in the research literature. Nodes in the maps represent specific knowledge, skills, and understandings in ELA and mathematics, as well as important foundational skills that provide an understructure for academic skills. The maps go beyond traditional learning progressions to include multiple pathways by which students develop content knowledge and skills.
Four broad claims were developed for ELA and mathematics, which were then subdivided into nine conceptual areas, to organize the highly complex learning maps. For a complete description, see Chapter 2 of the 2021–2022 Technical Manual—Instructionally Embedded Model (Dynamic Learning Maps Consortium, 2022). Claims are overt statements of what students are expected to learn and be able to demonstrate as a result of mastering skills within a very large neighborhood of the map. Conceptual areas are nested within claims and comprise multiple conceptually related content standards and the nodes that support and extend beyond the standards. The claims and conceptual areas apply to all grades in the DLM system.
Essential Elements (EEs) are specific statements of knowledge and skills, analogous to alternate or extended content standards. The EEs were developed by linking to the grade-level expectations identified in the Common Core State Standards. The purpose of the EEs is to build a bridge from the Common Core State Standards to academic expectations for students with the most significant cognitive disabilities.
Testlets are the basic units of measurement in the DLM system. Testlets are short, instructionally relevant measures of student knowledge, skills, and understandings. Each testlet is made up of three to nine assessment items. Assessment items are developed based on nodes at the five linkage levels for each EE. Each testlet measures an EE and linkage level, with the exception of writing testlets. See Chapter 4 of 2021–2022 Technical Manual—Instructionally Embedded Model (Dynamic Learning Maps Consortium, 2022) for a description of writing testlets. The Target linkage level reflects the grade-level expectation aligned directly to the EE. For each EE, small collections of nodes are identified earlier in the map that represent critical junctures on the path toward the grade-level expectation. Nodes are also identified beyond the Target at the Successor level to give students an opportunity to grow toward the grade-level targets for students without significant cognitive disabilities.
There are three levels below the Target and one level beyond the Target.
- Initial Precursor
- Distal Precursor
- Proximal Precursor
- Target
- Successor
3.2 Testlet and Item Writing
This section describes information pertaining to item writing and item writer demographics for the 2022–2023 year. For a complete summary of item and testlet development procedures, see Chapter 3 of the 2021–2022 Technical Manual—Instructionally Embedded Model (Dynamic Learning Maps Consortium, 2022).
3.2.1 2023 Testlet and Item Writing
Item development for 2022–2023 focused on replenishing and increasing the pool of testlets in all content areas. External item writers and internal test development staff develop items. External item writers focused on writing computer-delivered testlets. Due to the highly templated nature of the teacher-administered testlets, all ELA and mathematics teacher-administered testlets were developed internally by test development staff. A total of 326 computer-delivered testlets were produced by 64 item writers.
3.2.1.1 Item Writers
Item writers were selected from the Accessible Teaching, Learning, and Assessment Systems (ATLAS) MemberClicks database. The database is a profile-based recruitment tool hosted in MemberClicks and includes individuals recruited via the DLM governance board and social media, individuals who have previously participated in item writing, and individuals who created profiles via the “sign up to participate in DLM events” link on the DLM homepage. Interested individuals create and update their participant profile. Participant profiles include demographic, education, and work experience data.
A total of 695 individual profiles were initially invited to participate from the ATLAS MemberClicks database for 2023 item writing. Minimum eligibility criteria included at least 1 year of teaching experience, teaching in a DLM state, and experience with the DLM alternate assessment. Prior DLM event participation, subject matter expertise, population expertise, and distribution of experience in each grade band was also considered in selection and assignment to a subject area. Of the 695 individuals initially invited to participate, 64 individuals registered, completed advance training, and committed to attend the workshop. All 64 registered item writers attended both days of the training event and completed at least rounds 1 and 2 of item writing. Of these item writers, 34 developed ELA testlets and 30 developed mathematics testlets.
The demographics for the item writers are presented in Table 3.1. The median and range of years of teaching experience are shown in Table 3.2. Of the item writers who responded to the question, the median years of experience in pre-K–12 was 15 years for item writers of ELA and mathematics. Item writers equally represented Grades 3–8, with slightly less representation of high school. See Table 3.3 for a summary of item writers’ grade-level teaching experience.
| n | % | |
|---|---|---|
| Gender | ||
| Female | 60 | 93.8 |
| Male | 3 | 4.7 |
| Preferred to self-describe | 1 | 1.6 |
| Race | ||
| White | 59 | 92.2 |
| African American | 5 | 7.8 |
| Hispanic ethnicity | ||
| Non-Hispanic | 59 | 92.2 |
| Hispanic | 1 | 1.6 |
| Chose not to disclose | 4 | 6.2 |
| Teaching experience | n | Median | Range |
|---|---|---|---|
| Pre-K–12 | 57 | 15.0 | 3–32 |
| English language arts | 55 | 13.0 | 1–30 |
| Mathematics | 55 | 13.0 | 1–30 |
| Grade level | n | % |
|---|---|---|
| Grade 3 | 35 | 54.7 |
| Grade 4 | 37 | 57.8 |
| Grade 5 | 37 | 57.8 |
| Grade 6 | 36 | 56.2 |
| Grade 7 | 34 | 53.1 |
| Grade 8 | 36 | 56.2 |
| High school | 22 | 34.4 |
| Note. Item writers could indicate multiple grade levels. |
The 64 item writers represented a highly qualified group of professionals with both content and special education perspectives. The degrees held by item writers are shown in Table 3.4. All item writers held at least a bachelor’s degree. The majority of the item writers (n = 56; 88%) also held a master’s degree, for which the most common field of study was special education (n = 33; 59%).
| Degree | n | % |
|---|---|---|
| Bachelor’s degree | 64 | 100.0 |
| Education | 20 | 31.2 |
| Special education | 22 | 34.4 |
| Other | 18 | 28.1 |
| Missing | 4 | 6.2 |
| Master’s degree | 56 | 87.5 |
| Education | 17 | 30.4 |
| Special education | 33 | 58.9 |
| Other | 6 | 10.7 |
Item writers reported a range of experience working with students with different disabilities, as summarized in Table 3.5. Item writers collectively had the most experience working with students with multiple disabilities (n = 57; 89%), a significant cognitive disability (n = 55; 86%), or other health impairments (n = 54; 84%).
| Disability category | n | % |
|---|---|---|
| Blind/low vision | 32 | 50.0 |
| Deaf/hard of hearing | 30 | 46.9 |
| Emotional disability | 46 | 71.9 |
| Mild cognitive disability | 45 | 70.3 |
| Multiple disabilities | 57 | 89.1 |
| Orthopedic impairment | 32 | 50.0 |
| Other health impairment | 54 | 84.4 |
| Significant cognitive disability | 55 | 85.9 |
| Specific learning disability | 51 | 79.7 |
| Speech impairment | 45 | 70.3 |
| Traumatic brain injury | 29 | 45.3 |
| No disability | 2 | 3.1 |
| Note. Item writers could select multiple categories. |
The professional roles reported by the 2022–2023 item writers are shown in Table 3.6. While item writers had a range of professional roles, they were primarily classroom educators.
| Role | n | % |
|---|---|---|
| Building administrator | 1 | 1.6 |
| Classroom educator | 45 | 70.3 |
| District staff | 5 | 7.8 |
| Instructional coach | 6 | 9.4 |
| State education agency | 3 | 4.7 |
| University faculty/staff | 1 | 1.6 |
| Other | 3 | 4.7 |
Item writers came from 17 different states and the District of Columbia. The geographic areas of the institutions in which item writers taught or held a position is reported in Table 3.7. Within the survey, rural was defined as a population of fewer than 2,000 inhabitants, suburban was defined as a city of 2,000–50,000 inhabitants, and urban was defined as a city of more than 50,000 inhabitants.
| Geographic area | n | % |
|---|---|---|
| Rural | 26 | 40.6 |
| Suburban | 19 | 29.7 |
| Urban | 19 | 29.7 |
3.2.1.2 Item-Writing Process
The item-writing process for 2022–2023 began with item writers completing three advance training modules: an overview of the DLM module and two content-specific modules (either ELA or mathematics). In January 2023, item writers and staff gathered in Kansas City for an on-site item-writing workshop. During this workshop, item writers received additional training and worked on producing and peer reviewing two computer-delivered testlets. Following the on-site workshop, item writers continued producing and peer reviewing computer-delivered testlets virtually via a secure online platform through April 2023.
Between January 2023 and April 2023, staff developed items for teacher-administered testlets internally. This is due to the highly templated nature of the teacher-administered testlets.
Item writers produced a total of 326 computer-delivered testlets (176 in ELA and 150 in mathematics). DLM staff produced a total of 72 teacher-administered testlets (31 in ELA and 41 in mathematics).
3.2.2 External Reviews
3.2.2.1 Items and Testlets
The purpose of external reviews of items and testlets is to evaluate whether items and testlets measure the intended content, are accessible, and are free of bias or sensitive content. Panelists use external review criteria established for DLM alternate assessments to rate items and recommend to “accept”, “revise”, or “reject” items and testlets. External review panelists provide recommendations for revise ratings and explanations for reject ratings. The test development team uses collective feedback from the panelists to inform decisions about items and testlets prior to field-testing.
The content reviews of items and testlets for 2022–2023 were conducted during 2-day virtual meetings. The accessibility and bias/sensitivity reviews for 2022–2023 were conducted during 3-day virtual meetings.
3.2.2.1.1 Overview of Review Process
Panelists were selected from the ATLAS MemberClicks database based on predetermined qualifications for each panel type. Panelists were assigned to content, accessibility, or bias and sensitivity panels based on their qualifications.
In 2023, there were 33 panelists. Of those, seven were ELA panelists and six were mathematics panelists. There were also 16 accessibility panelists and four bias and sensitivity panelists who reviewed items and testlets from all subjects.
Prior to participating in the virtual panel meetings, panelists completed an advance training course that included an External Review Procedures module and a module that specifically aligned to their assigned panel type. The content modules were subject-specific, while the accessibility and bias and sensitivity modules were universal for both subjects. After each module, panelists completed a quiz and were required to score 80% or higher to continue to the next stage of training.
Following the completion of advance training, panelists met with their panels in a virtual environment. Each panel was led by an ATLAS facilitator and co-facilitator. Facilitators provided additional training on the training platform and criteria used to review items and testlets. Panelists began their reviews by engaging in a calibration collection (two testlets) to calibrate their expectations for the review. Following the calibration sets, panelists reviewed collections of items and testlets independently. Once all panelists completed the review, facilitators used a discussion protocol known as the Rigorous Item Feedback protocol to discuss any items or testlets that were rated either revise or reject by a panelist to obtain collective feedback about those items and testlets. The Rigorous Item Feedback protocol helps facilitators elicit detailed, substantive feedback from panelists and record feedback in a uniform fashion. Following the discussion, panelists were given another collection of items and testlets to review. This process was repeated until all collections of items and testlets were reviewed. Collections ranged from eight to 17 testlets, depending on the panel type. Content panels had fewer testlets per collection, and bias and sensitivity and accessibility panels had more testlets per collection.
3.2.2.1.2 External Reviewers
The demographics for the external reviewers are presented in Table 3.8. The median and range of years of teaching experience are shown in Table 3.9. The median years of experience for external reviewers was 17 years in pre-K–12, 14 years in ELA, and 13 years in mathematics. External reviewers represented all grade levels, with slightly greater representation for Grades 6–8 and high school. See Table 3.10 for a summary.
| n | % | |
|---|---|---|
| Gender | ||
| Female | 29 | 87.9 |
| Male | 4 | 12.1 |
| Race | ||
| White | 29 | 87.9 |
| African American | 2 | 6.1 |
| American Indian | 1 | 3.0 |
| Chose not to disclose | 1 | 3.0 |
| Hispanic ethnicity | ||
| Non-Hispanic | 30 | 90.9 |
| Hispanic | 1 | 3.0 |
| Chose not to disclose | 2 | 6.1 |
| Teaching experience | Median | Range |
|---|---|---|
| Pre-K–12 | 17.0 | 8–39 |
| English language arts | 13.5 | 1–39 |
| Mathematics | 13.0 | 1–31 |
| Grade level | n | % |
|---|---|---|
| Grade 3 | 17 | 51.5 |
| Grade 4 | 15 | 45.5 |
| Grade 5 | 21 | 63.6 |
| Grade 6 | 26 | 78.8 |
| Grade 7 | 24 | 72.7 |
| Grade 8 | 23 | 69.7 |
| High school | 22 | 66.7 |
| Note. Reviewers could indicate multiple grade levels. |
The 33 external reviewers represented a highly qualified group of professionals. The level of degree and most common types of degrees held by external reviewers are shown in Table 3.11. A majority (n = 24; 73%) also held a master’s degree, for which the most common field of study was special education (n = 14; 58%).
| Degree | n | % |
|---|---|---|
| Bachelor’s degree | 33 | 100.0 |
| Education | 10 | 30.3 |
| Special education | 10 | 30.3 |
| Other | 11 | 33.3 |
| Missing | 2 | 6.1 |
| Master’s degree | 24 | 72.7 |
| Education | 4 | 16.7 |
| Special education | 14 | 58.3 |
| Other | 6 | 25.0 |
Most external reviewers had experience working with students with disabilities (88%), and 82% had experience with the administration of alternate assessments. The variation in percentages suggests some item writers may have had experience with administration of alternate assessments but perhaps did not regularly work with students with disabilities.
External reviewers reported a range of experience working with students with different disabilities, as summarized in Table 3.12. External reviewers collectively had the most experience working with students with a specific learning disability (n = 26; 79%), a mild cognitive disability (n = 25; 76%), or multiple disabilities (n = 24; 73%).
| Disability category | n | % |
|---|---|---|
| Blind/low vision | 14 | 42.4 |
| Deaf/hard of hearing | 10 | 30.3 |
| Emotional disability | 24 | 72.7 |
| Mild cognitive disability | 25 | 75.8 |
| Multiple disabilities | 24 | 72.7 |
| Orthopedic impairment | 10 | 30.3 |
| Other health impairment | 20 | 60.6 |
| Significant cognitive disability | 21 | 63.6 |
| Specific learning disability | 26 | 78.8 |
| Speech impairment | 22 | 66.7 |
| Traumatic brain injury | 11 | 33.3 |
| Note. Reviewers could select multiple categories. |
Panelists had varying experience teaching students with the most significant cognitive disabilities. ELA and mathematics panelists had a median of 14 years of experience teaching students with the most significant cognitive disabilities, with a minimum of 7 years and a maximum of 31 years of experience.
The professional roles reported by the 2022–2023 reviewers are shown in Table 3.13. While the reviewers had a range of professional roles, they were primarily classroom educators.
| Role | n | % |
|---|---|---|
| Classroom educator | 30 | 90.9 |
| District staff | 1 | 3.0 |
| Instructional coach | 1 | 3.0 |
| Other | 1 | 3.0 |
ELA and mathematics panelists were from eight different states. The geographic areas of institutions in which reviewers taught or held a position is reported in Table 3.14. Within the survey, rural was defined as a population of fewer than 2,000 inhabitants, suburban was defined as a city of 2,000–50,000 inhabitants, and urban was defined as a city of more than 50,000 inhabitants.
| Geographic area | n | % |
|---|---|---|
| Rural | 20 | 60.6 |
| Urban | 9 | 27.3 |
| Suburban | 4 | 12.1 |
3.2.2.1.3 Results of External Reviews
For ELA, the percentage of items and testlets rated as “accept” across panels and rounds of review ranged from 70% to 96% and from 52% to 87%, respectively. The percentage of items and testlets rated as “revise” across panels and rounds of review ranged from 13% to 48% and from 4% to 30%, respectively. No ELA items or testlets were recommended for rejection.
For mathematics, the percentage of items and testlets rated as “accept” ranged from 37% to 95% and from 47% to 85%, respectively, across panels and rounds of review. The percentage of items and testlets rated as “revise” across panels and rounds of review ranged from 5% to 63% and from 15% to 53%, respectively. No mathematics items or testlets were recommended for rejection.
3.2.2.1.4 Test Development Team Decisions
Because each item and testlet is examined by three distinct panels, ratings were compiled across panels, following the process described in Chapter 3 of the 2021–2022 Technical Manual—Instructionally Embedded Model (Dynamic Learning Maps Consortium, 2022). The test development team reviews the collective feedback provided by panelists for each item and testlet. Once the test development team views each item and testlet and considers the feedback provided by the panelists, it assigns one of the following decisions to each one: (a) accept as is; (b) minor revision, pattern of minor concerns, will be addressed; (c) major revision needed; (d) reject; and (e) more information needed.
The ELA test development team accepted 72% of testlets and 93% of items as is. Of the items and testlets that were revised, only minor changes (e.g., minor rewording but concept remained unchanged) were required, as opposed to major changes (e.g., stem or response option replaced). The ELA test development team made 17 minor revisions and did not reject any testlets.
The mathematics test development team accepted 40% of testlets and 27% of items as is. Of the items and testlets that were revised, most required major changes (e.g., stem or response option replaced) as opposed to minor changes (e.g., minor rewording but concept remained unchanged). The mathematics test development team made 36 minor revisions and 184 major revisions to items and did not reject any testlets.
Most of the items and testlets reviewed will be field-tested during the fall 2023 or spring 2024 windows.
3.2.2.2 External Review of ELA Texts
The purpose of the external review of texts is to ensure they are representing the intended content, are accessible, are free of bias and sensitivity concerns, and include appropriate imagery. Panelists use external review criteria to rate texts as accept, revise, or reject and provide recommendations for revise ratings or provide an explanation for reject ratings. The ELA test development team uses the collective feedback from the panelists to inform decisions about texts and images before they are used in item and testlet development.
External review of texts for 2022–2023 took place during 2-day virtual panel meetings. During the virtual meetings, facilitators led the feedback discussions and recorded decisions. Senior members of the DLM leadership team used their industry experience to help the ELA team revise established text criteria to better reflect current assessment knowledge and practice. The following criteria were added to the text content criteria for panelists to use during their review of the texts.
- Consistency of Text Elements: Images do not contain features that contradict aspects of the text or other images in the text.
- Characters: Images of the same person represent a character consistently within and across text collections. Images of characters in texts align with the characterization in the source books (age, race, historical context).
- Objects/Settings: Images of the same objects and settings are used consistently within texts. Images used to present objects focus on a single object and do not suggest any element that conflicts with how the objects are described in the text.
- Node Support: The text and images provide a sufficient opportunity to assess the associated node(s). Items that elicit evidence of the targeted cognition for the typical range of test takers could be written using the text.
The following criterion was added to the text bias and sensitivity criteria for panelists to use during their review of texts (the addition is italicized).
- Diversity: Where applicable, there is fair representation of diversity in race, ethnicity, gender, disability, and family composition.
- Informational Texts Images in informational texts should include depictions of gender, racial, disability, and ethnic diversity where appropriate and possible. If it is impossible to show diversity in a single image, diversity should be demonstrated across images, both within and across texts.
3.2.2.2.1 Recruitment, Training, Panel Meetings, and Results
Panelists were selected from the ATLAS MemberClicks database based on predetermined qualifications for each panel type. Panelists were assigned to content, accessibility, or bias and sensitivity panels based on their qualifications.
This year, 46 panelists who had experience with ELA content and/or experience with students with significant cognitive disabilities were recruited to participate. Of the 46 panelists, 37 (80%) were primarily classroom teachers, two (5%) were retired teachers, and seven (15%) had other roles (i.e., instructional coach, item developer, administration). Panelists had varying experience teaching students with severe cognitive disabilities, with a median of 10 years of experience, a minimum of 2 years of experience, and a maximum of 35 years of experience. Of panelists who disclosed their ethnicity, 45 (98%) were non-Hispanic and one (2%) was Hispanic. Among the panelists, 44 (96%) were female and two (4%) were male. Panelists taught or worked in a mix of rural (n = 26, 57%), suburban (n = 11, 24%), and urban (n = 9, 19%) locations. Panelists represented 10 partner states, including four Instructionally Embedded model states and six Year-End model states.
Panelists individually completed the advance training module prior to the panel meetings. Additional training on the structure and process of consensus discussions, panel specific criteria, and resources were provided at the beginning of the panel meeting. During the panel meetings, panelists were given time to read and take notes about a text. Once all panelists had completed the review, facilitators used the Rigorous Item Feedback protocol, which was originally developed for item review and adapted to text review with the aid of an external consultant. The co-facilitator recorded consensus ratings and recommendations for revision on text rating sheets. In cases where panelists recommended revisions, texts were revised to enhance language clarity, cohere with images, or better align with the text criteria. All texts were either accepted based on reviews or accepted after making revisions (Table 3.15).
| Ratings | Panel recommendation | Final staff decision |
|---|---|---|
| Accept as is | 1 | 3 |
| Revise | 29 | 27 |
| Reject | 0 | 0 |
3.3 Evidence of Item Quality
Each year, testlets are added to and removed from the operational pool to maintain a pool of high-quality testlets. The following sections describe evidence of item quality, including evidence supporting field-test testlets available for administration, a summary of the operational pool, and evidence of DIF.
3.3.1 Field-Testing
During 2022–2023, DLM field-test testlets were administered to evaluate item quality before promoting testlets to the operational pool. Adding additional testlets to the operational pool allows for multiple testlets to be available in each assessment window. This means that teachers have the ability to assess the same EE and linkage level multiple times, if desired, and reduces item exposure for the EEs and linkage levels that are assessed most frequently. Additionally, deepening the operational pool allows for testlets to be evaluated for retirement in instances in which other testlets show better performance.
In this section, we describe the field-test testlets administered in 2022–2023 and the associated review activities. A summary of prior field-test events can be found in Chapter 3 of the 2021–2022 Technical Manual—Instructionally Embedded Model (Dynamic Learning Maps Consortium, 2022).
3.3.1.1 Description of Field Tests Administered in 2022–2023
The Instructionally Embedded and Year-End assessment models share a common item pool, and testlets field-tested during the instructionally embedded assessment window may be eventually promoted to the spring assessment window.
Testlets were made available for field-testing based on the availability of field-test content for each EE and linkage level.
During the spring assessment window, field-test testlets were administered to each student after blueprint coverage requirements were met. A field-test testlet was assigned for an EE that was assessed during the operational assessment at a linkage level equal or adjacent to the linkage level of the operational testlet.
Table 3.16 summarizes the number of field-test testlets available during 2022–2023. A total of 633 were available across grades, subjects, and windows.
|
Fall window
|
Spring window
|
|||
|---|---|---|---|---|
| Grade | English language arts (n) | Mathematics (n) | English language arts (n) | Mathematics (n) |
| 3 | 17 | 9 | 28 | 22 |
| 4 | 8 | 13 | 21 | 27 |
| 5 | 8 | 11 | 23 | 25 |
| 6 | 11 | 6 | 24 | 18 |
| 7 | 6 | 13 | 20 | 28 |
| 8 | 16 | 18 | 31 | 27 |
| 9 | 11 | 9 | 28 | 16 |
| 10 | 11 | 8 | 28 | 16 |
| 11 | 7 | 6 | 19 | 18 |
| 12 | 7 | 19 | ||
Table 3.17 presents the demographic breakdown of students completing field-test testlets in ELA and mathematics in 2022–2023. Consistent with the DLM population, approximately 67% of students completing field-test testlets were male, approximately 60% were White, and approximately 75% were non-Hispanic. The vast majority of students completing field-test testlets were not English-learner eligible or monitored. The students completing field-test testlets were split across the four complexity bands, with most students assigned to Band 1 or Band 2. See Chapter 4 of this manual for a description of the student complexity bands.
|
English language
arts |
Mathematics
|
|||
|---|---|---|---|---|
| Demographic group | n | % | n | % |
| Gender | ||||
| Male | 46,000 | 67.4 | 47,450 | 67.5 |
| Female | 22,186 | 32.5 | 22,761 | 32.4 |
| Nonbinary/undesignated | 70 | 0.1 | 72 | 0.1 |
| Race | ||||
| White | 39,543 | 57.9 | 40,652 | 57.8 |
| African American | 14,285 | 20.9 | 14,698 | 20.9 |
| 7,660 | 11.2 | 7,957 | 11.3 | |
| Asian | 4,021 | 5.9 | 4,158 | 5.9 |
| American Indian | 2,149 | 3.1 | 2,211 | 3.1 |
| Native Hawaiian or Pacific Islander | 439 | 0.6 | 438 | 0.6 |
| Alaska Native | 159 | 0.2 | 169 | 0.2 |
| Hispanic ethnicity | ||||
| Non-Hispanic | 51,563 | 75.5 | 52,802 | 75.1 |
| Hispanic | 16,693 | 24.5 | 17,481 | 24.9 |
| English learning (EL) participation | ||||
| Not EL eligible or monitored | 63,584 | 93.2 | 65,444 | 93.1 |
| EL eligible or monitored | 4,672 | 6.9 | 4,839 | 6.8 |
| English language arts complexity band | ||||
| Foundational | 10,286 | 15.1 | 10,355 | 14.7 |
| Band 1 | 28,302 | 41.5 | 28,822 | 41.0 |
| Band 2 | 23,860 | 35.0 | 24,915 | 35.4 |
| Band 3 | 5,808 | 8.5 | 6,191 | 8.8 |
| Mathematics complexity band | ||||
| Foundational | 10,632 | 15.6 | 10,648 | 15.2 |
| Band 1 | 28,025 | 41.1 | 28,585 | 40.7 |
| Band 2 | 24,788 | 36.3 | 25,899 | 36.8 |
| Band 3 | 4,811 | 7.0 | 5,151 | 7.3 |
| Note See Chapter 4 of this manual for a description of student complexity bands. | ||||
Participation in field-testing was not required, but educators were encouraged to administer all available testlets to their students. Field-test participation rates for ELA and mathematics in the spring window are shown in Table 3.18. Note that because the Instructionally Embedded and Year-End models share an item pool, participation numbers are combined across all states. In total, 66% of students in ELA and 69% of students in mathematics completed at least one field-test testlet. In the spring window, 94% of field-test testlets had a sample size of at least 20 students.
|
Spring window
|
||
|---|---|---|
| Subject | n | % |
| English language arts | 68,256 | 66.5 |
| Mathematics | 70,283 | 68.6 |
3.3.1.2 Results of Item Analysis
All flagged items are reviewed by test development teams following field-testing. Items are flagged if they meet either of the following statistical criteria:
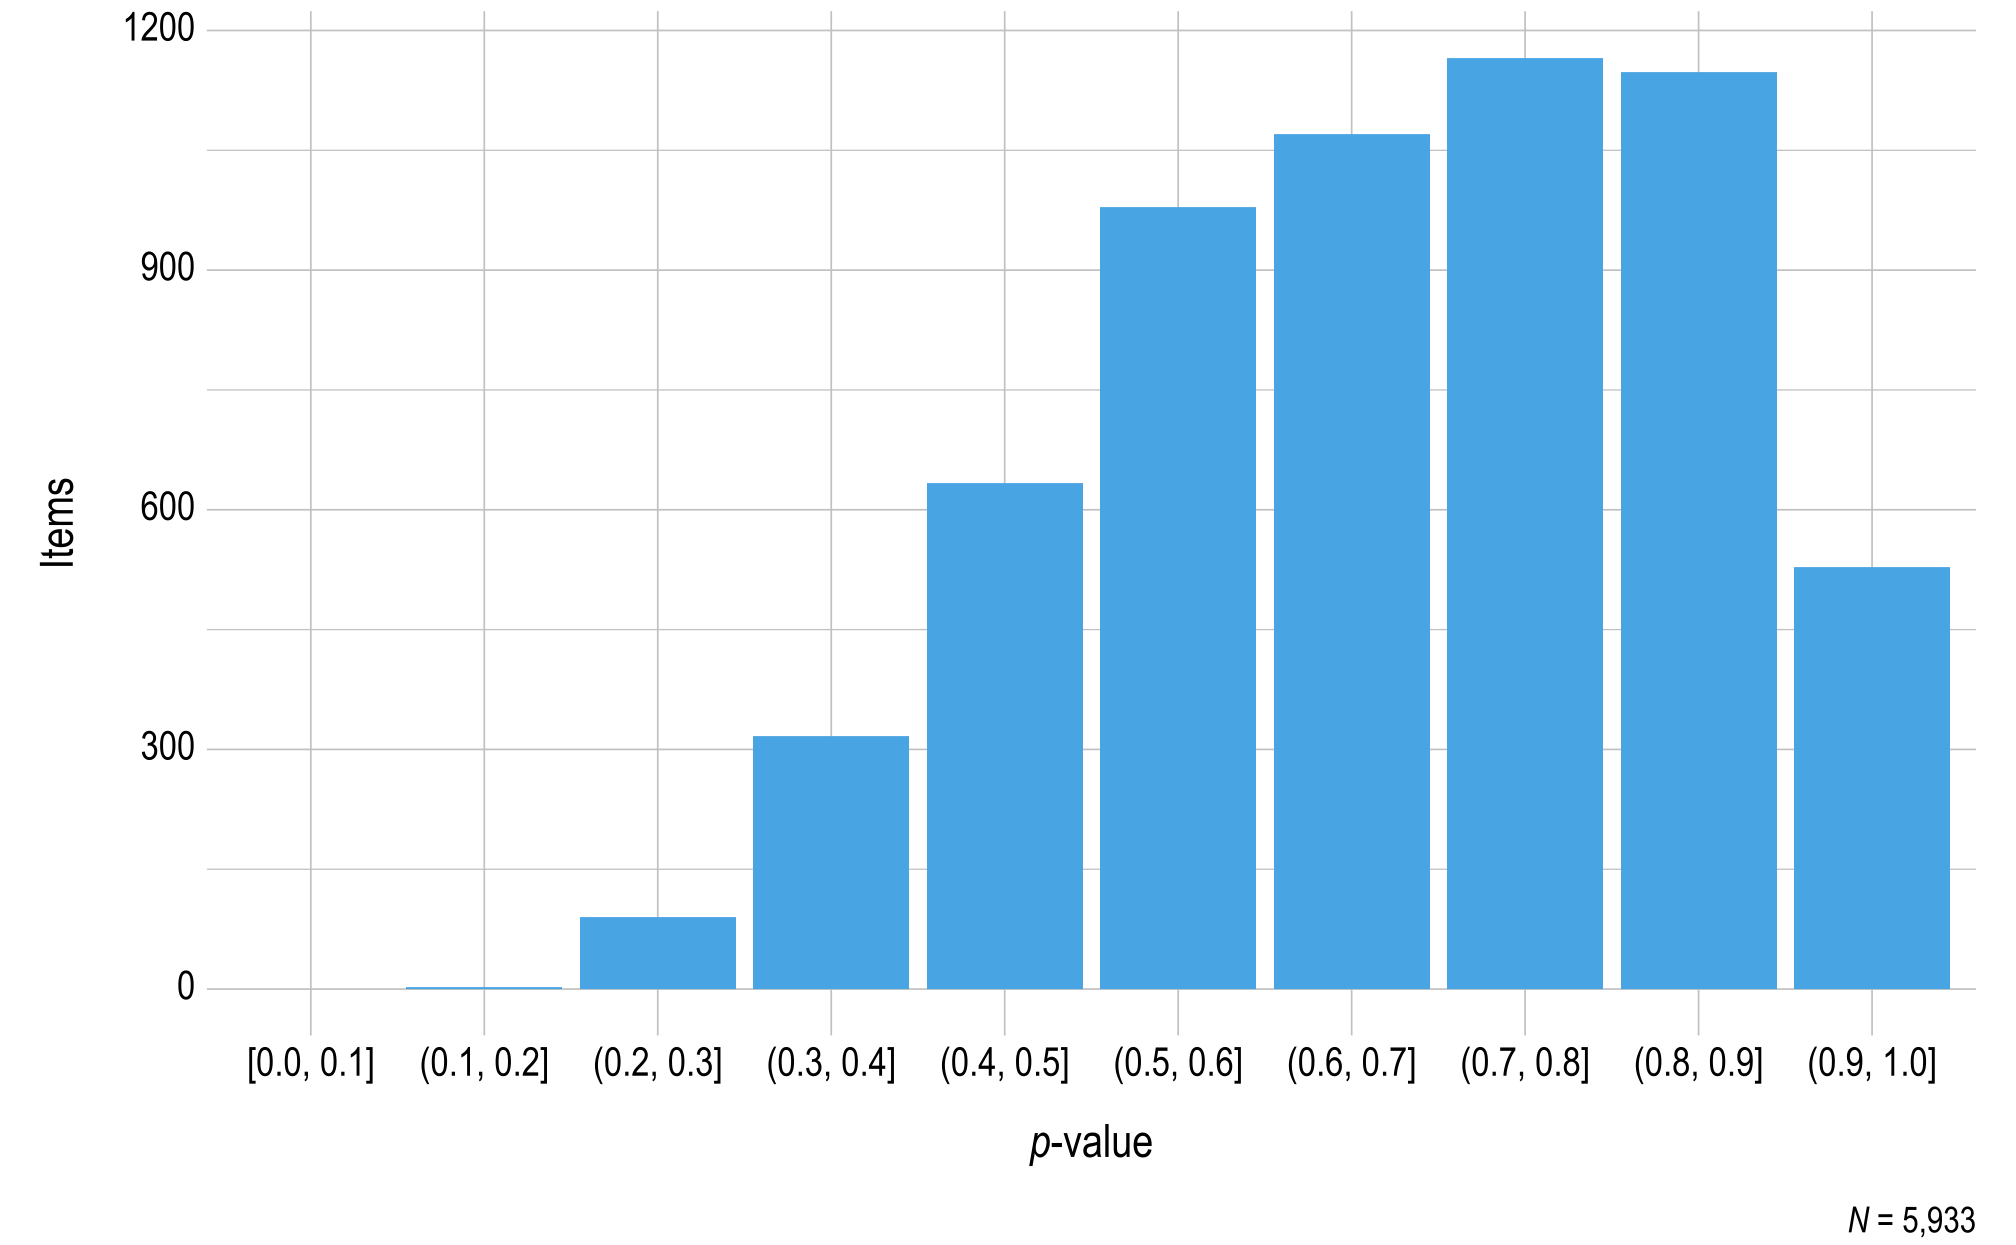
The item is too challenging, as indicated by a p-value less than .35. This value was selected as the threshold for flagging because most DLM assessment items offer three response options, so a value less than .35 may indicate less than chance selection of the correct response option.
The item is significantly easier or harder than other items assessing the same EE and linkage level, as indicated by a weighted standardized difference greater than two standard deviations from the mean p-value for that EE and linkage level combination.
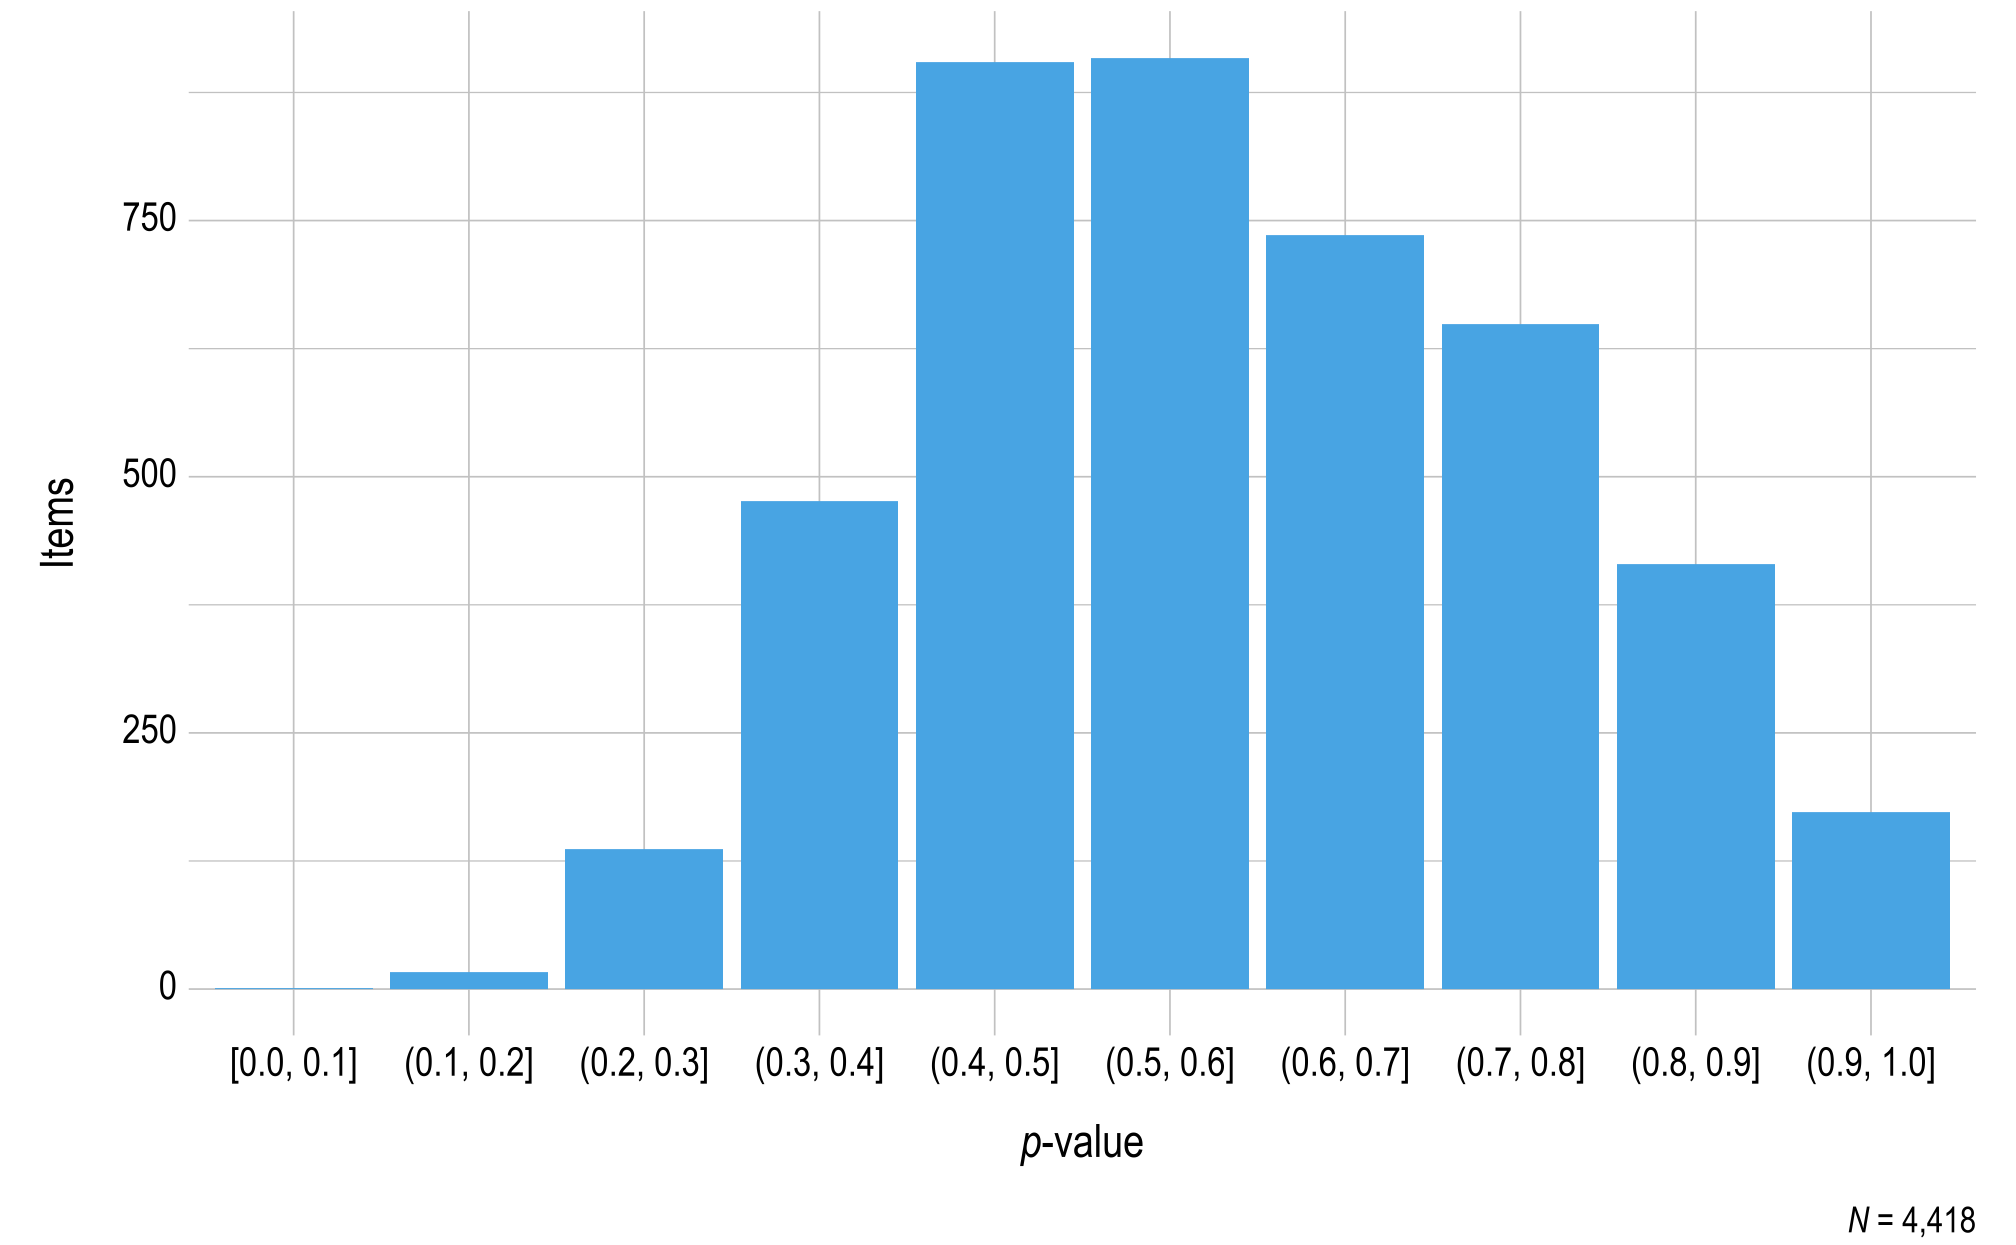
Figure 3.1 and Figure 3.2 summarize the p-values for items that met the minimum sample size threshold of 20. Most items fell above the .35 threshold for flagging. In ELA, 851 items (95%) were above the .35 flagging threshold. In mathematics, 749 items (83%) were above the .35 flagging threshold. Test development teams for each subject reviewed 48 items (5%) for ELA and 154 items (17%) for mathematics that were below the threshold.
Figure 3.1: p-values for English Language Arts 2022–2023 Field-Test Items
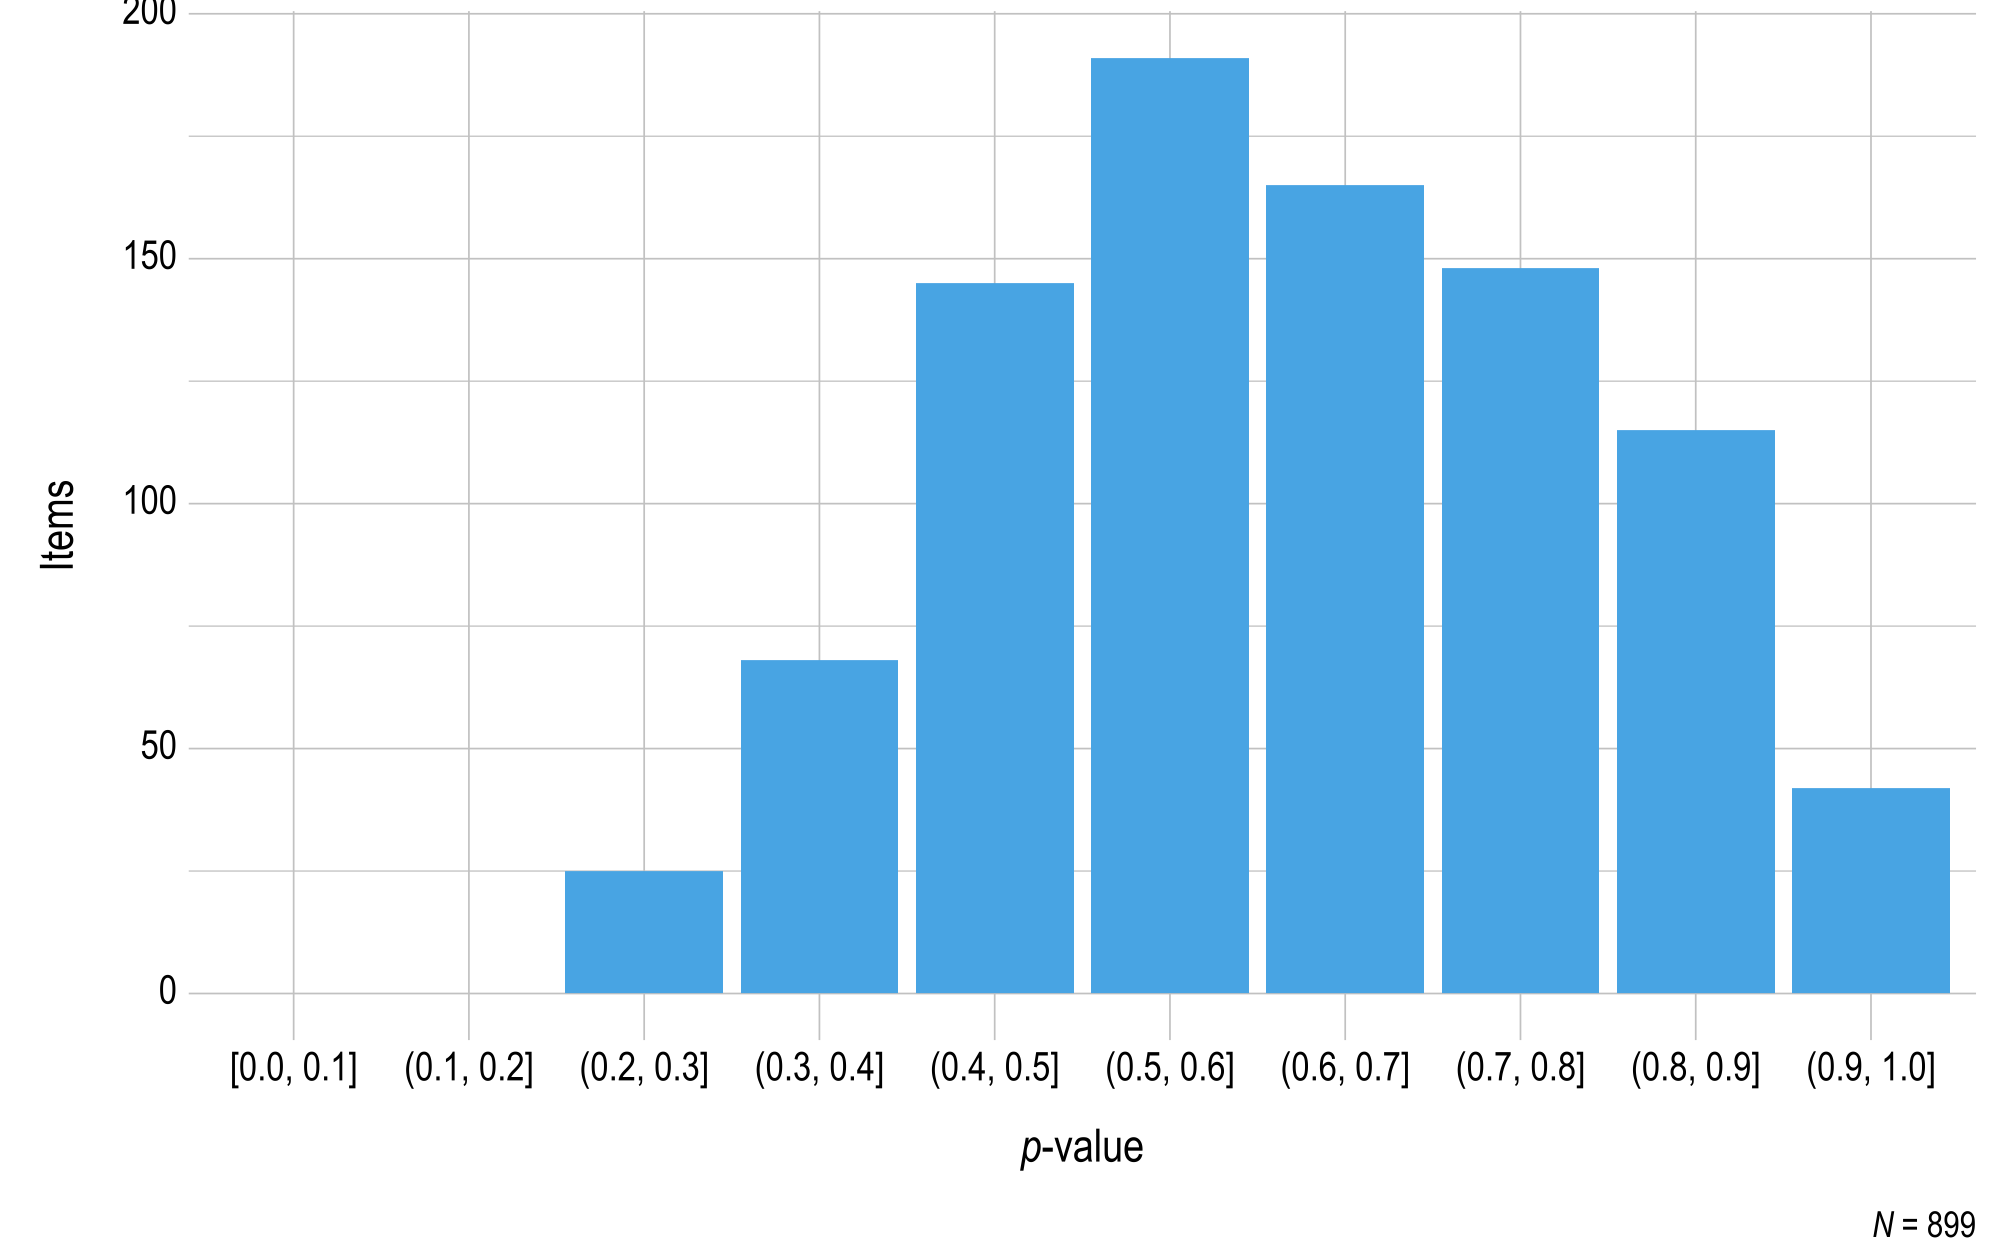
Note. Items with a sample size less than 20 were omitted.
Figure 3.2: p-values for Mathematics 2022–2023 Field-Test Items
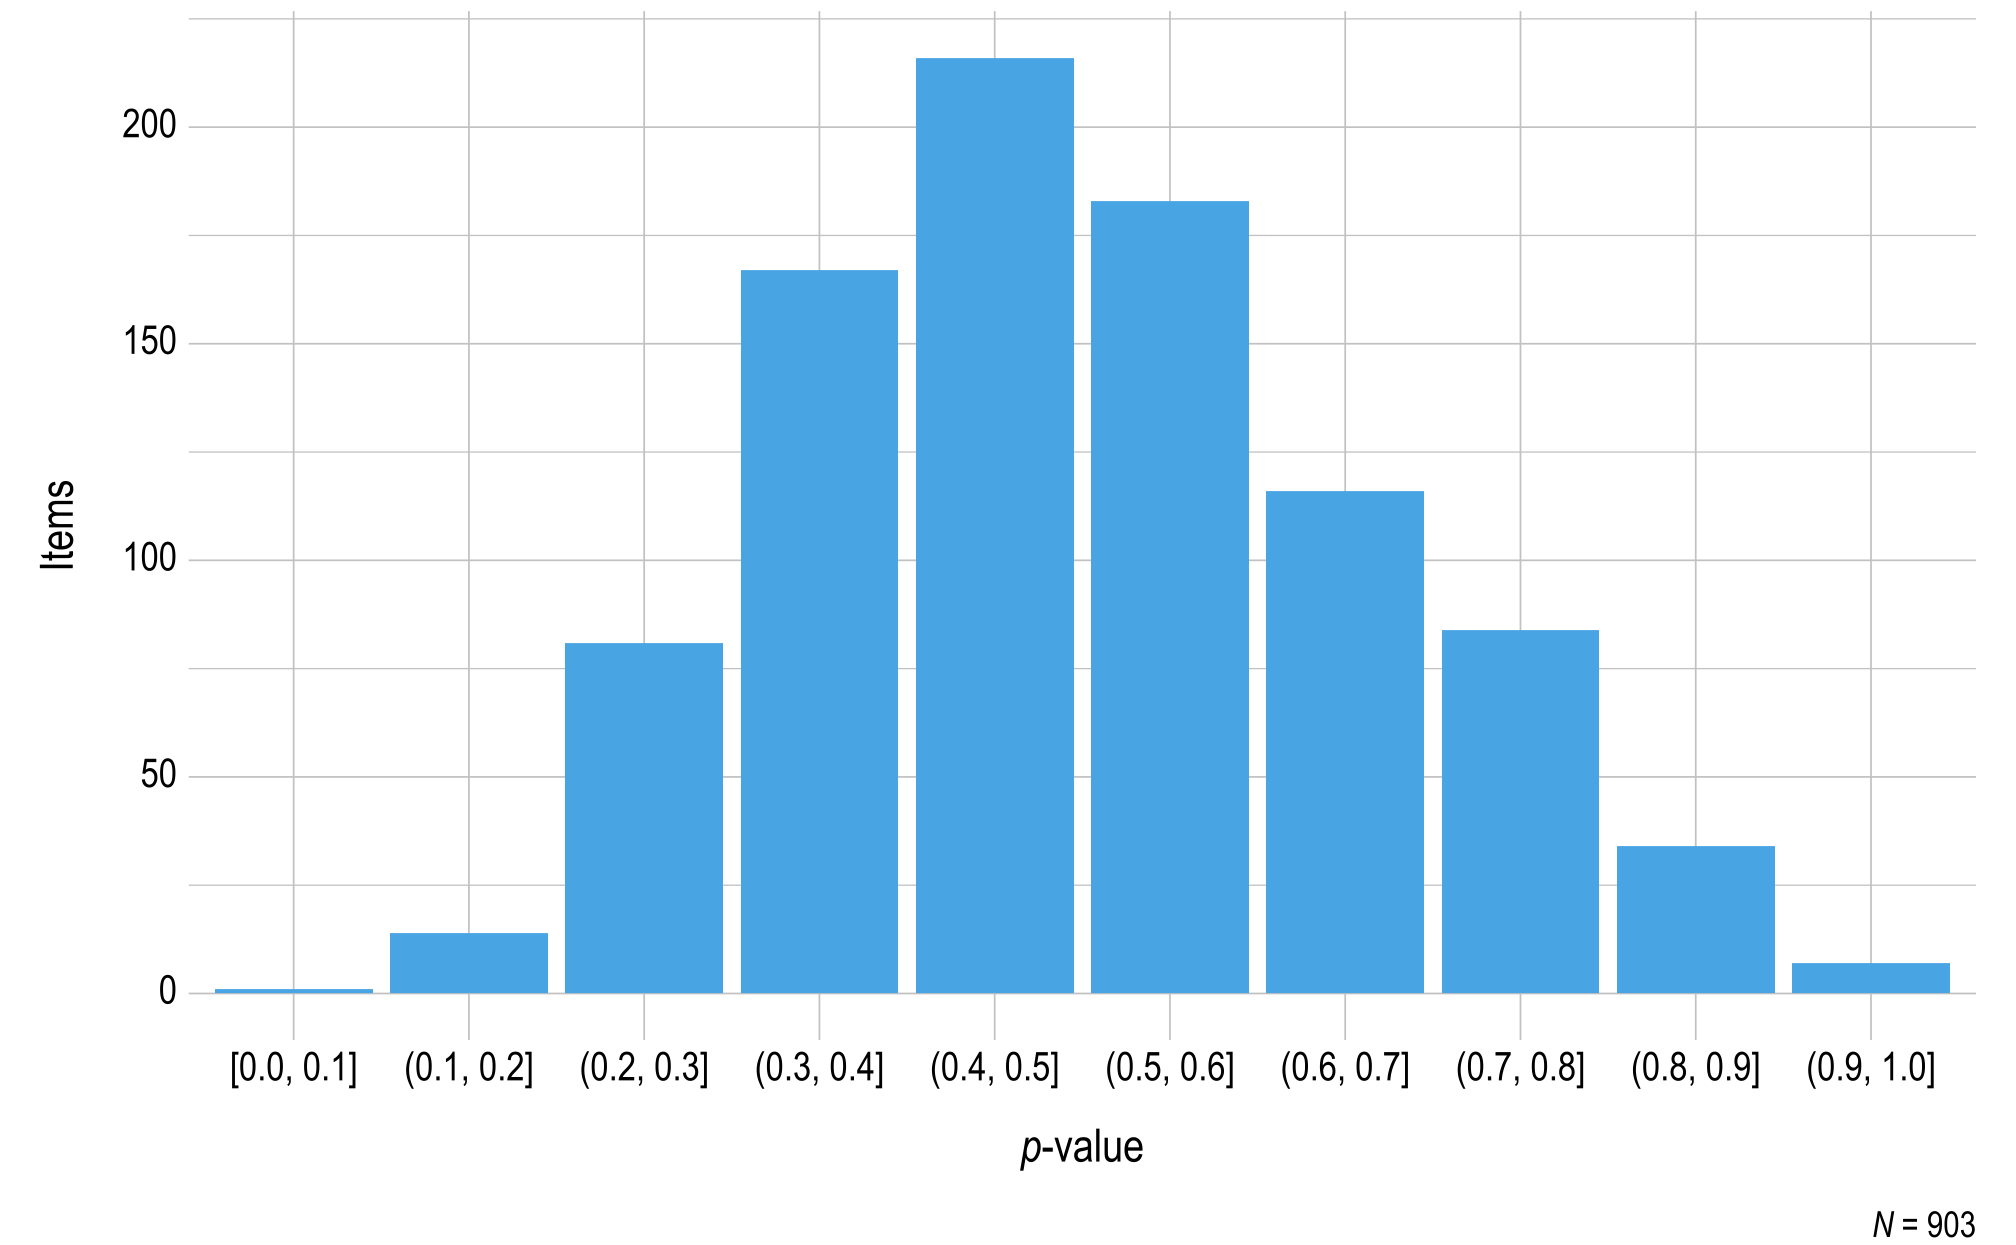
Note. Items with a sample size less than 20 were omitted.
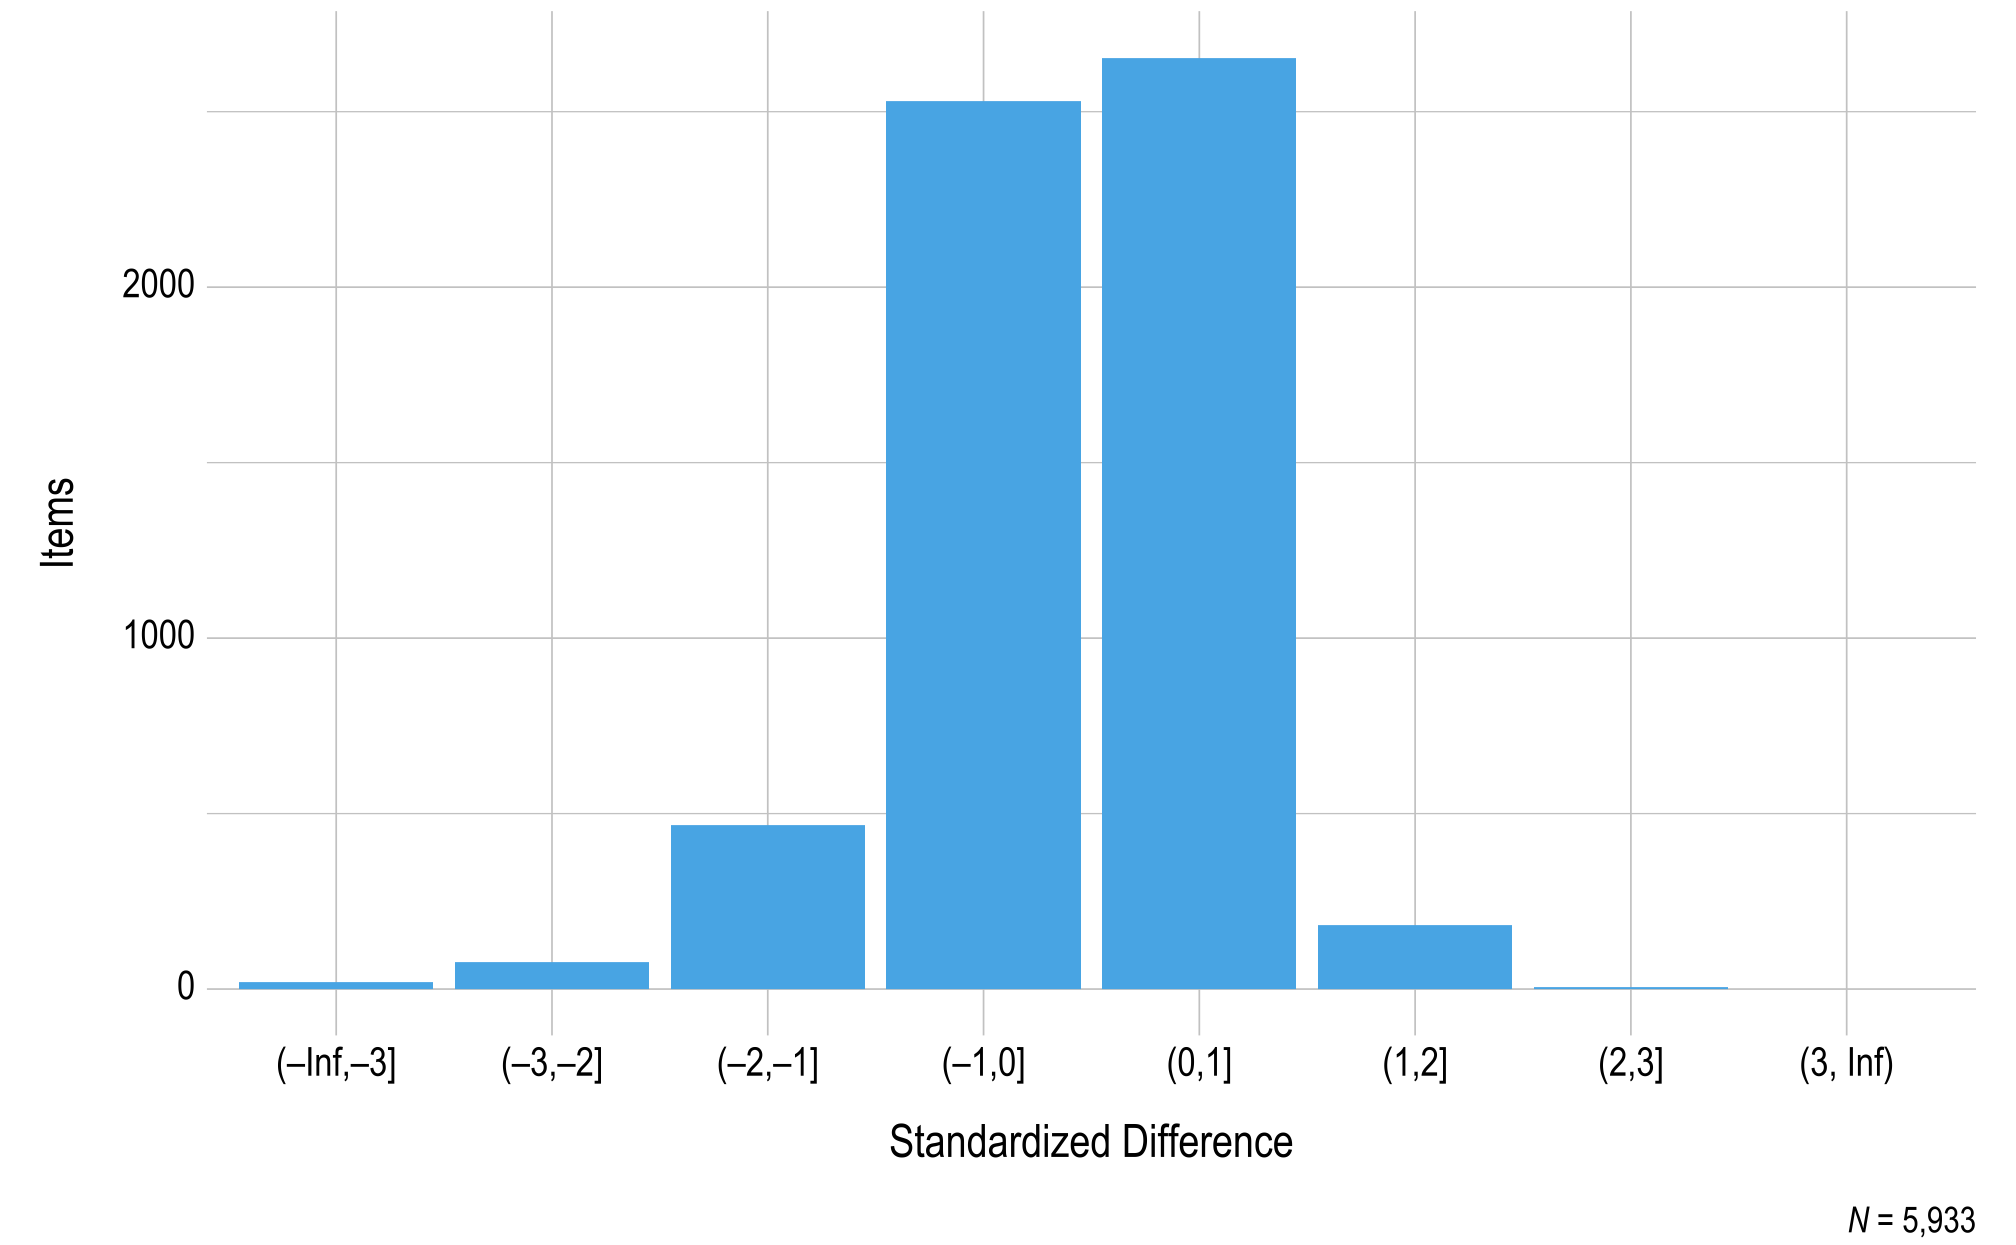
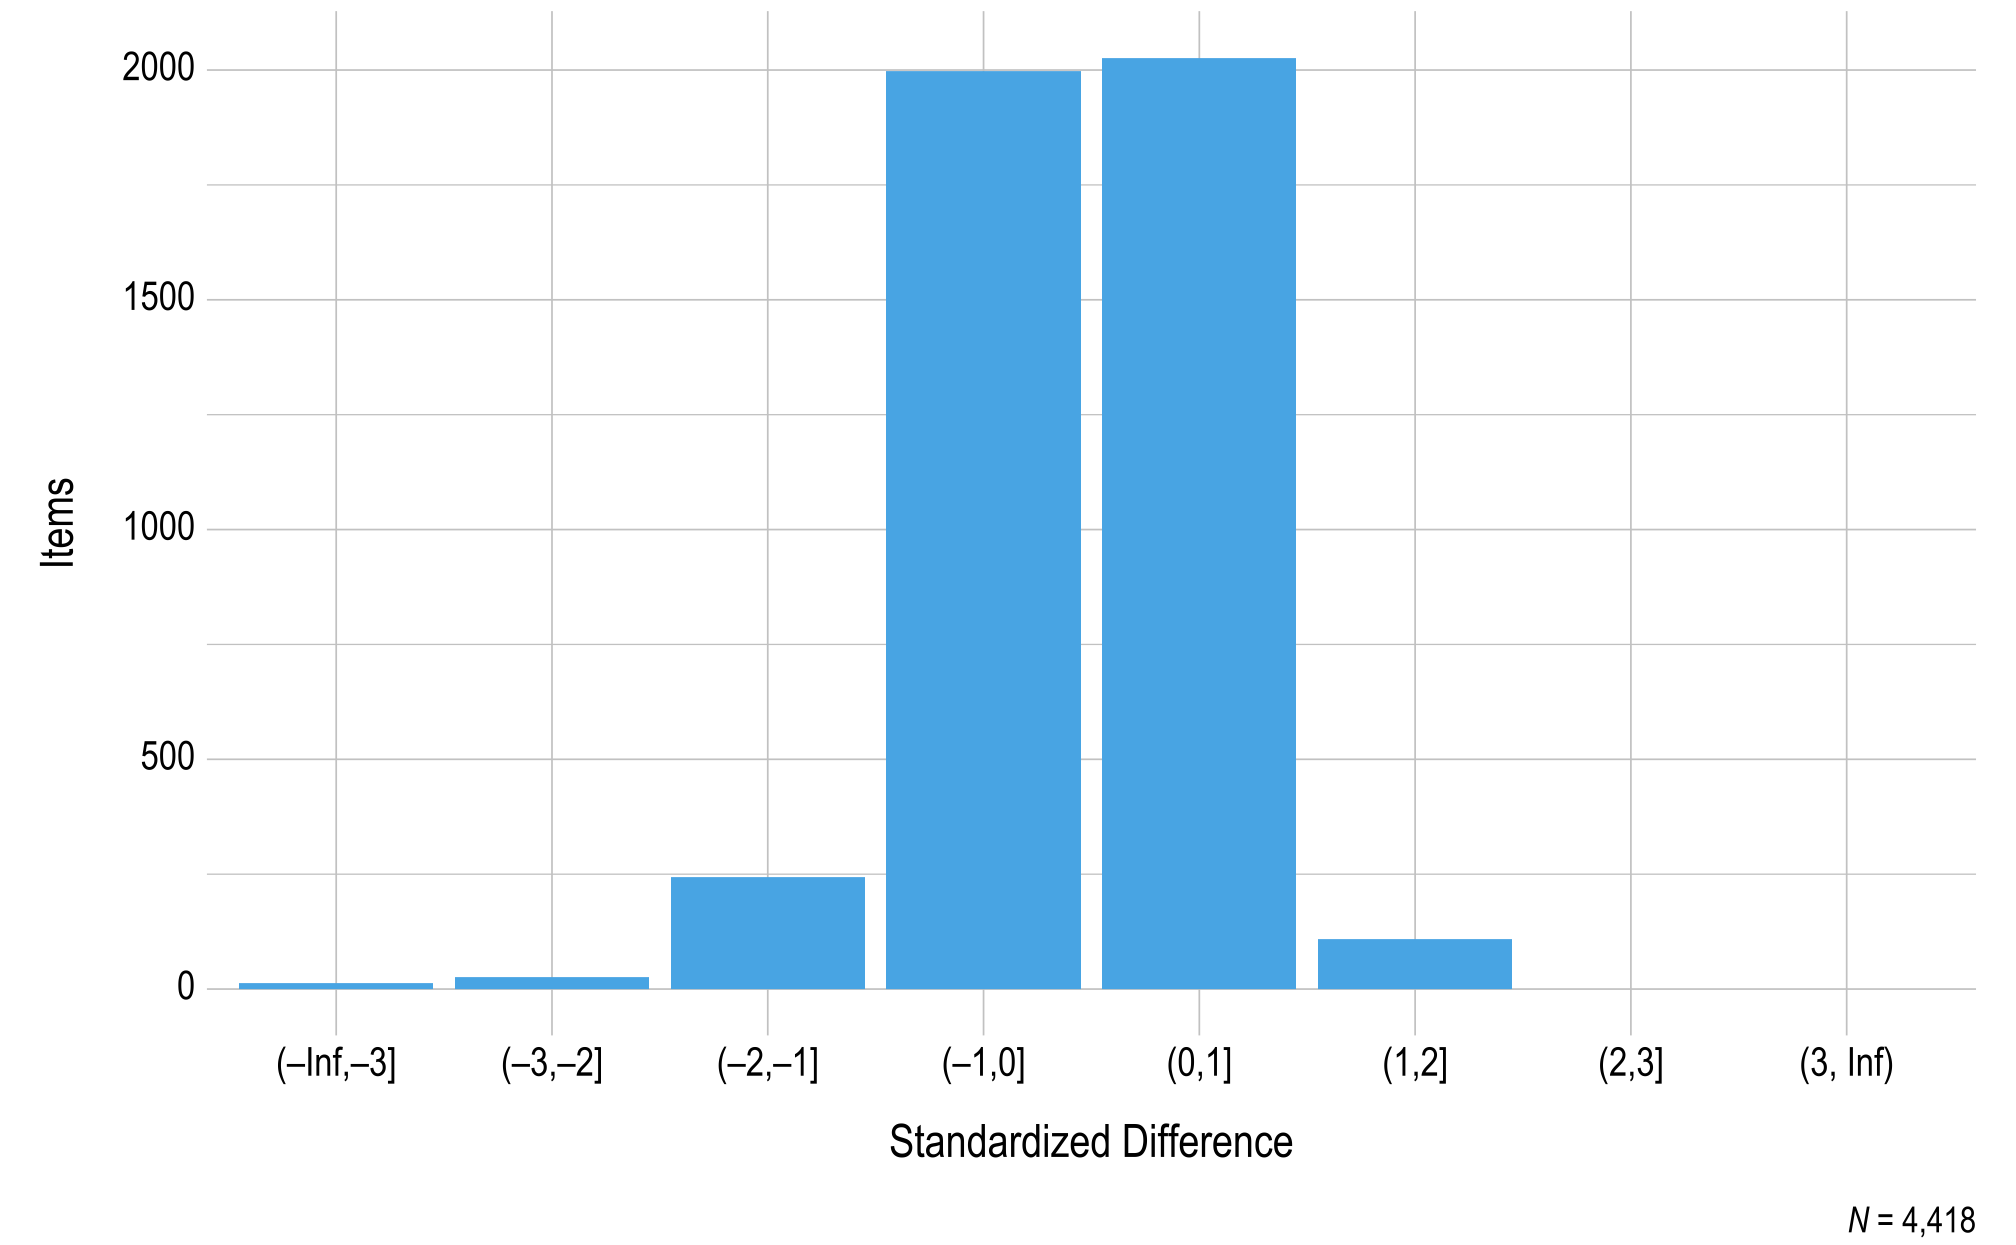
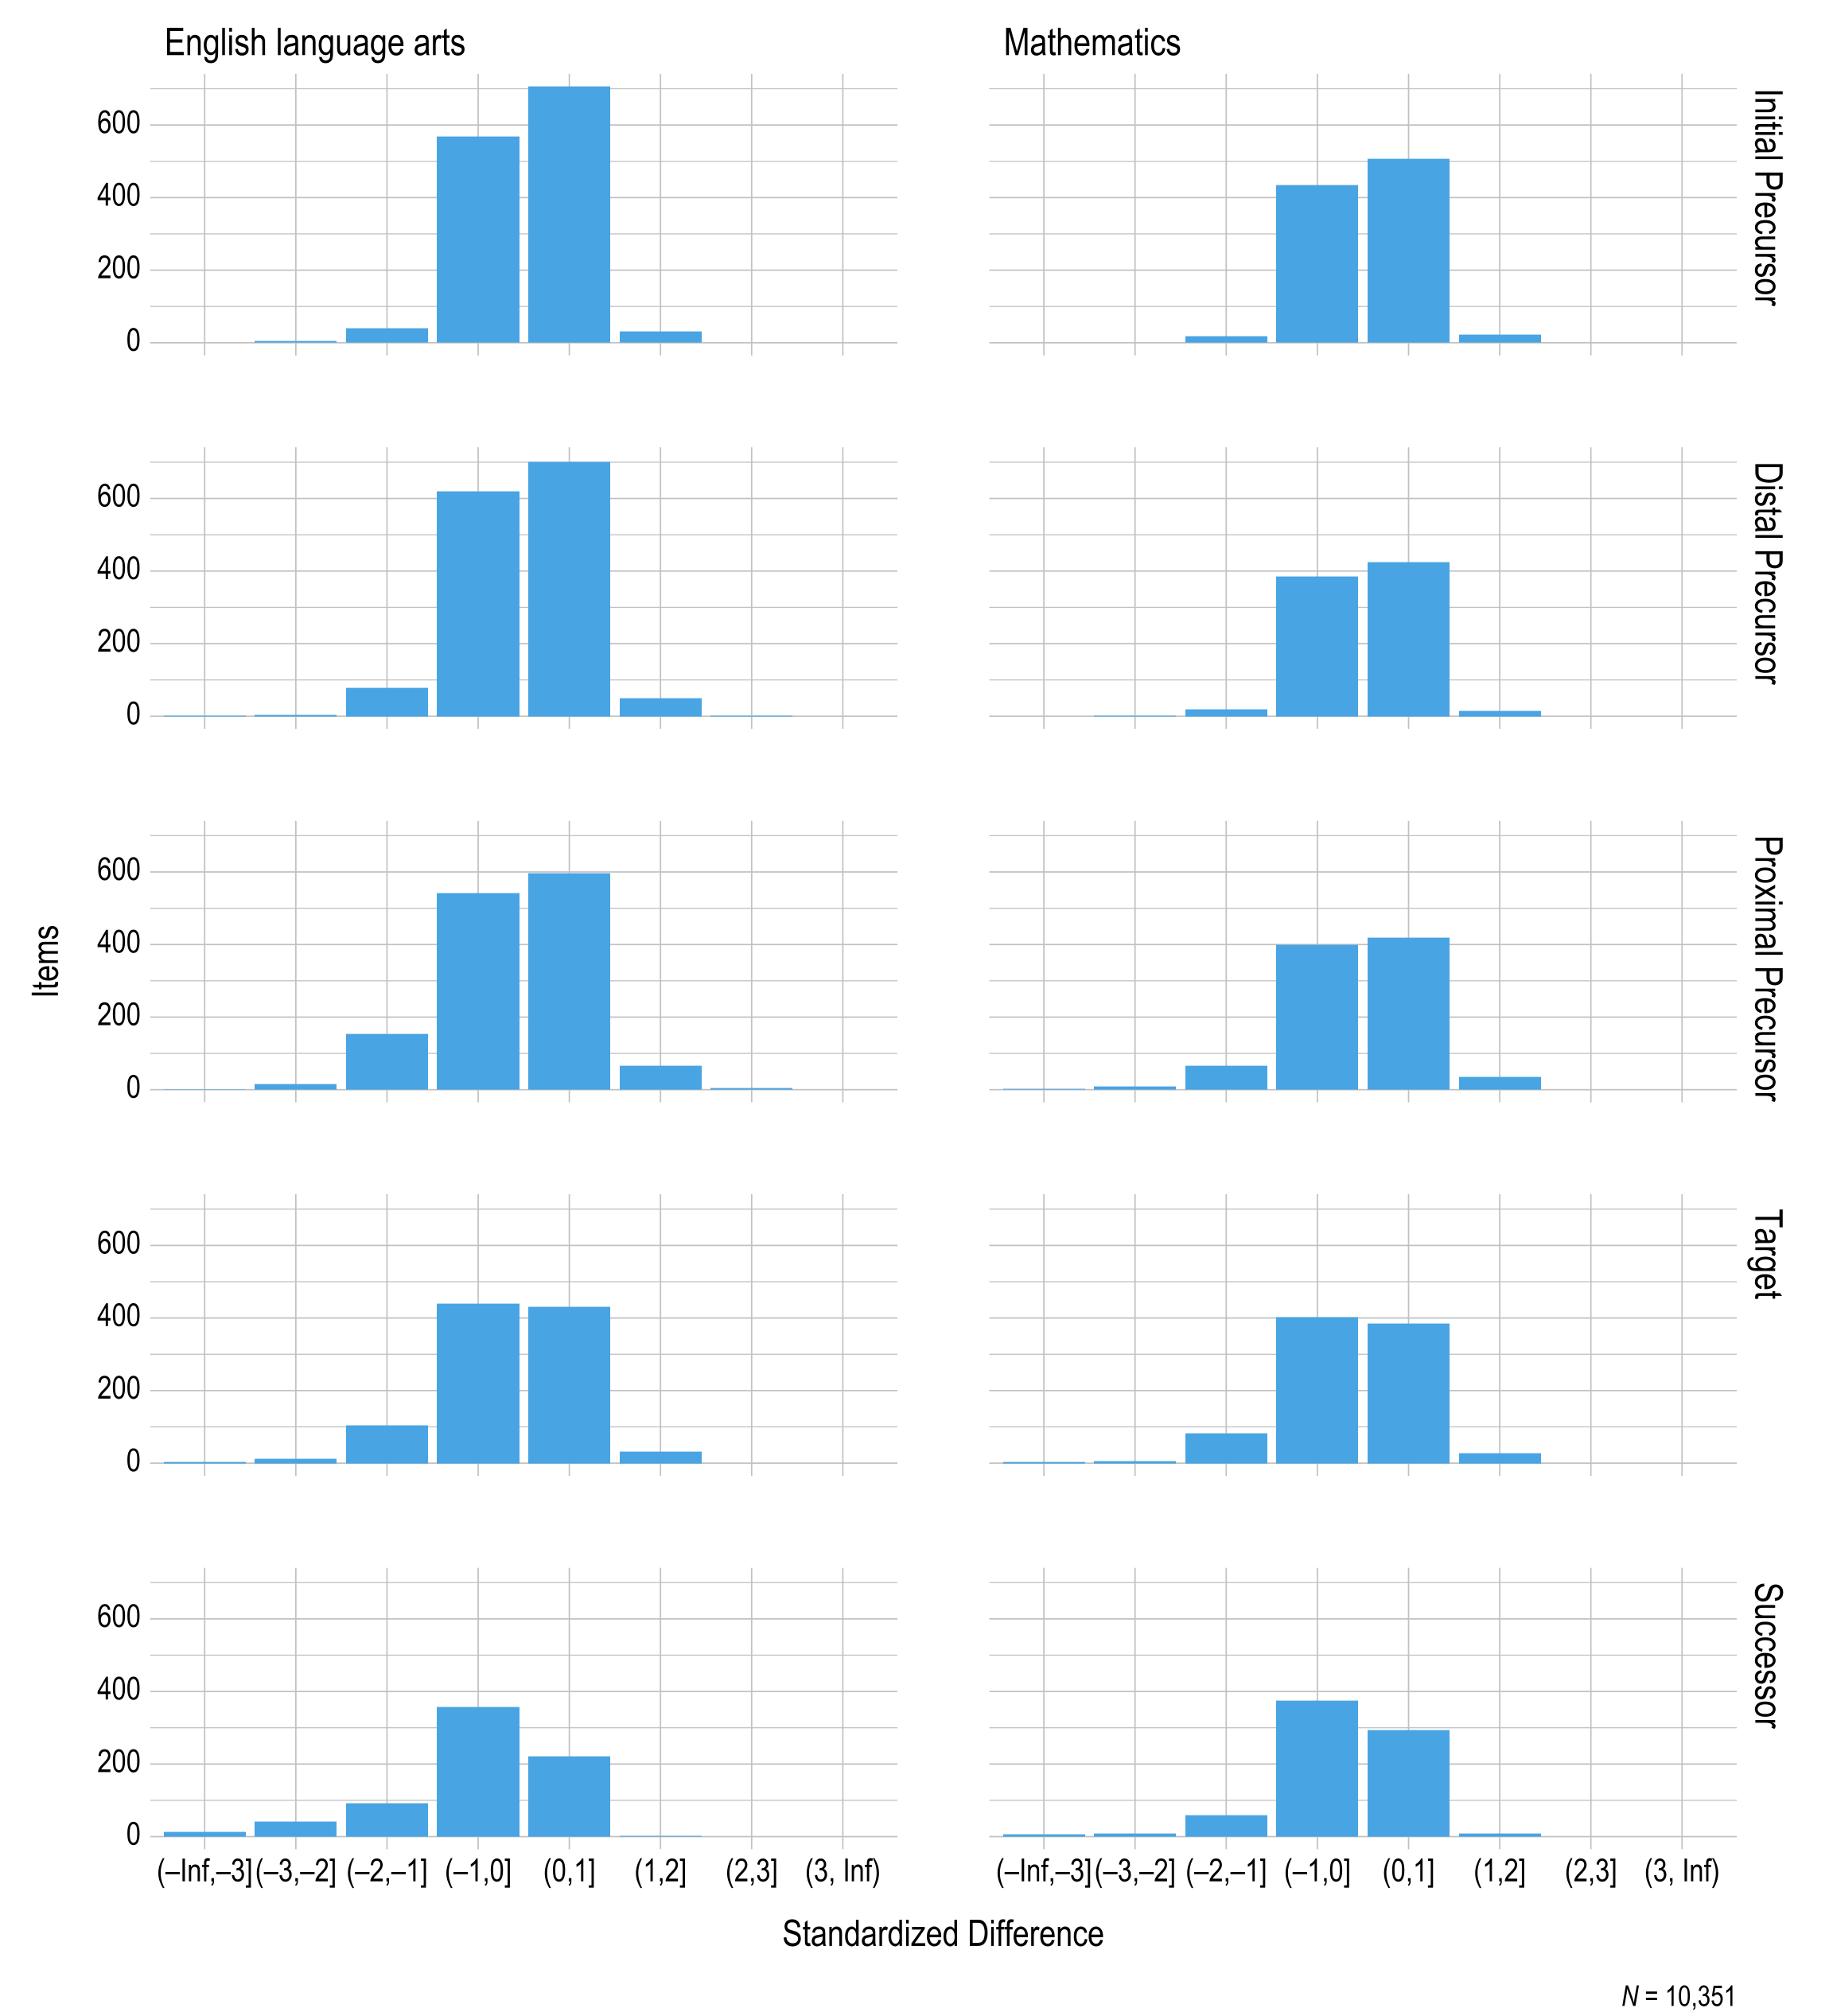
Items in the DLM assessments are designed and developed to be fungible (i.e., interchangeable) within each EE and linkage level, meaning field-test items should perform consistently with the operational items measuring the same EE and linkage level. To evaluate whether field-test items perform similarly to operational items measuring the same EE and linkage level, standardized difference values were also calculated for the field-test items. Figure 3.3 and Figure 3.4 summarize the standardized difference values for items field-tested during the instructionally embedded window for ELA and mathematics, respectively. Most items fell within two standard deviations of the mean for the EE and linkage level. Items beyond the threshold were reviewed by test development teams for each subject.
Figure 3.3: Standardized Difference Z-Scores for English Language Arts 2022–2023 Field-Test Items
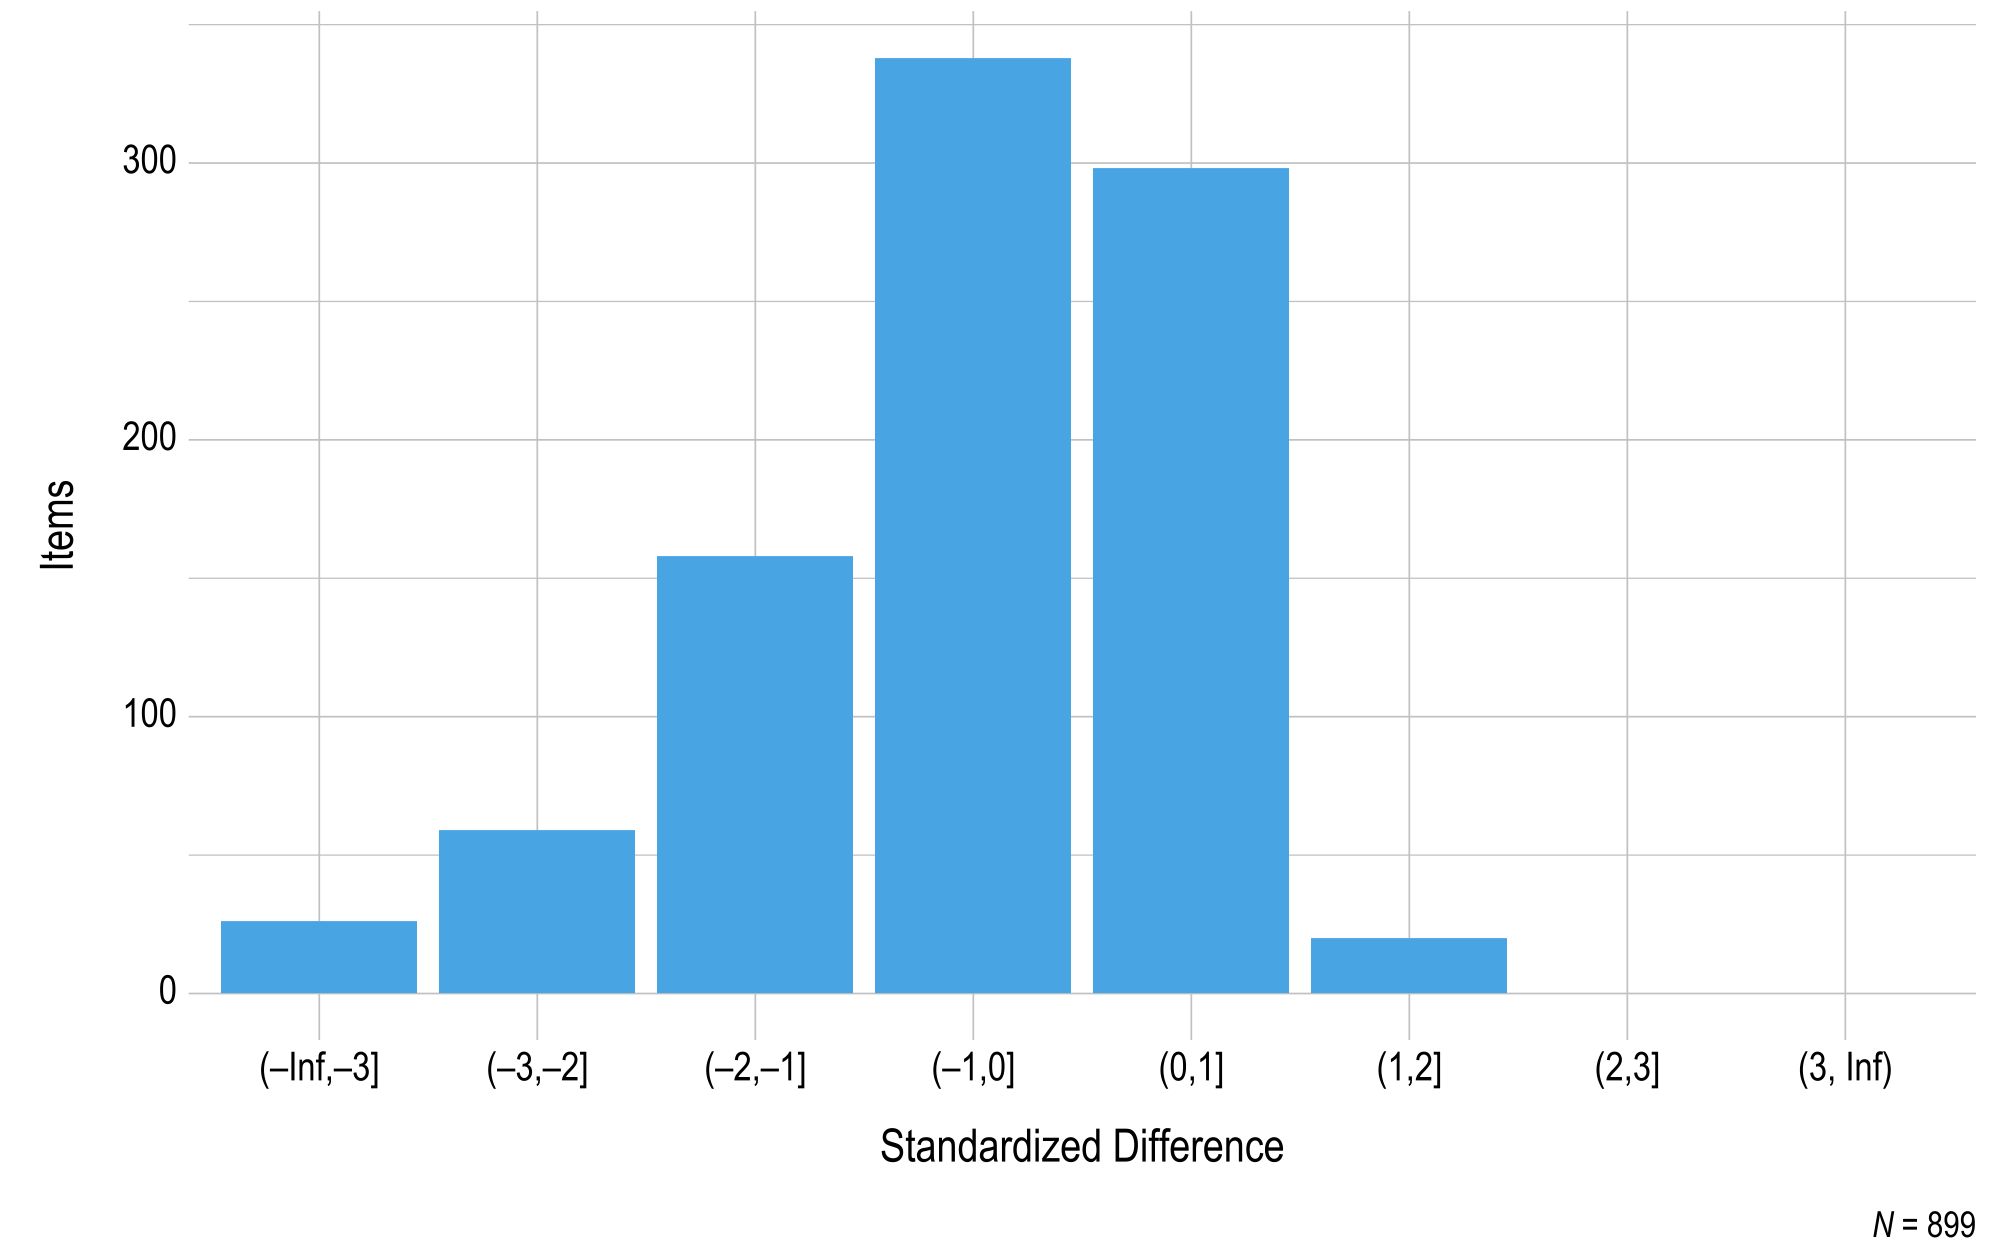
Note. Items with a sample size less than 20 were omitted.
Figure 3.4: Standardized Difference Z-Scores for Mathematics 2022–2023 Field-Test Items
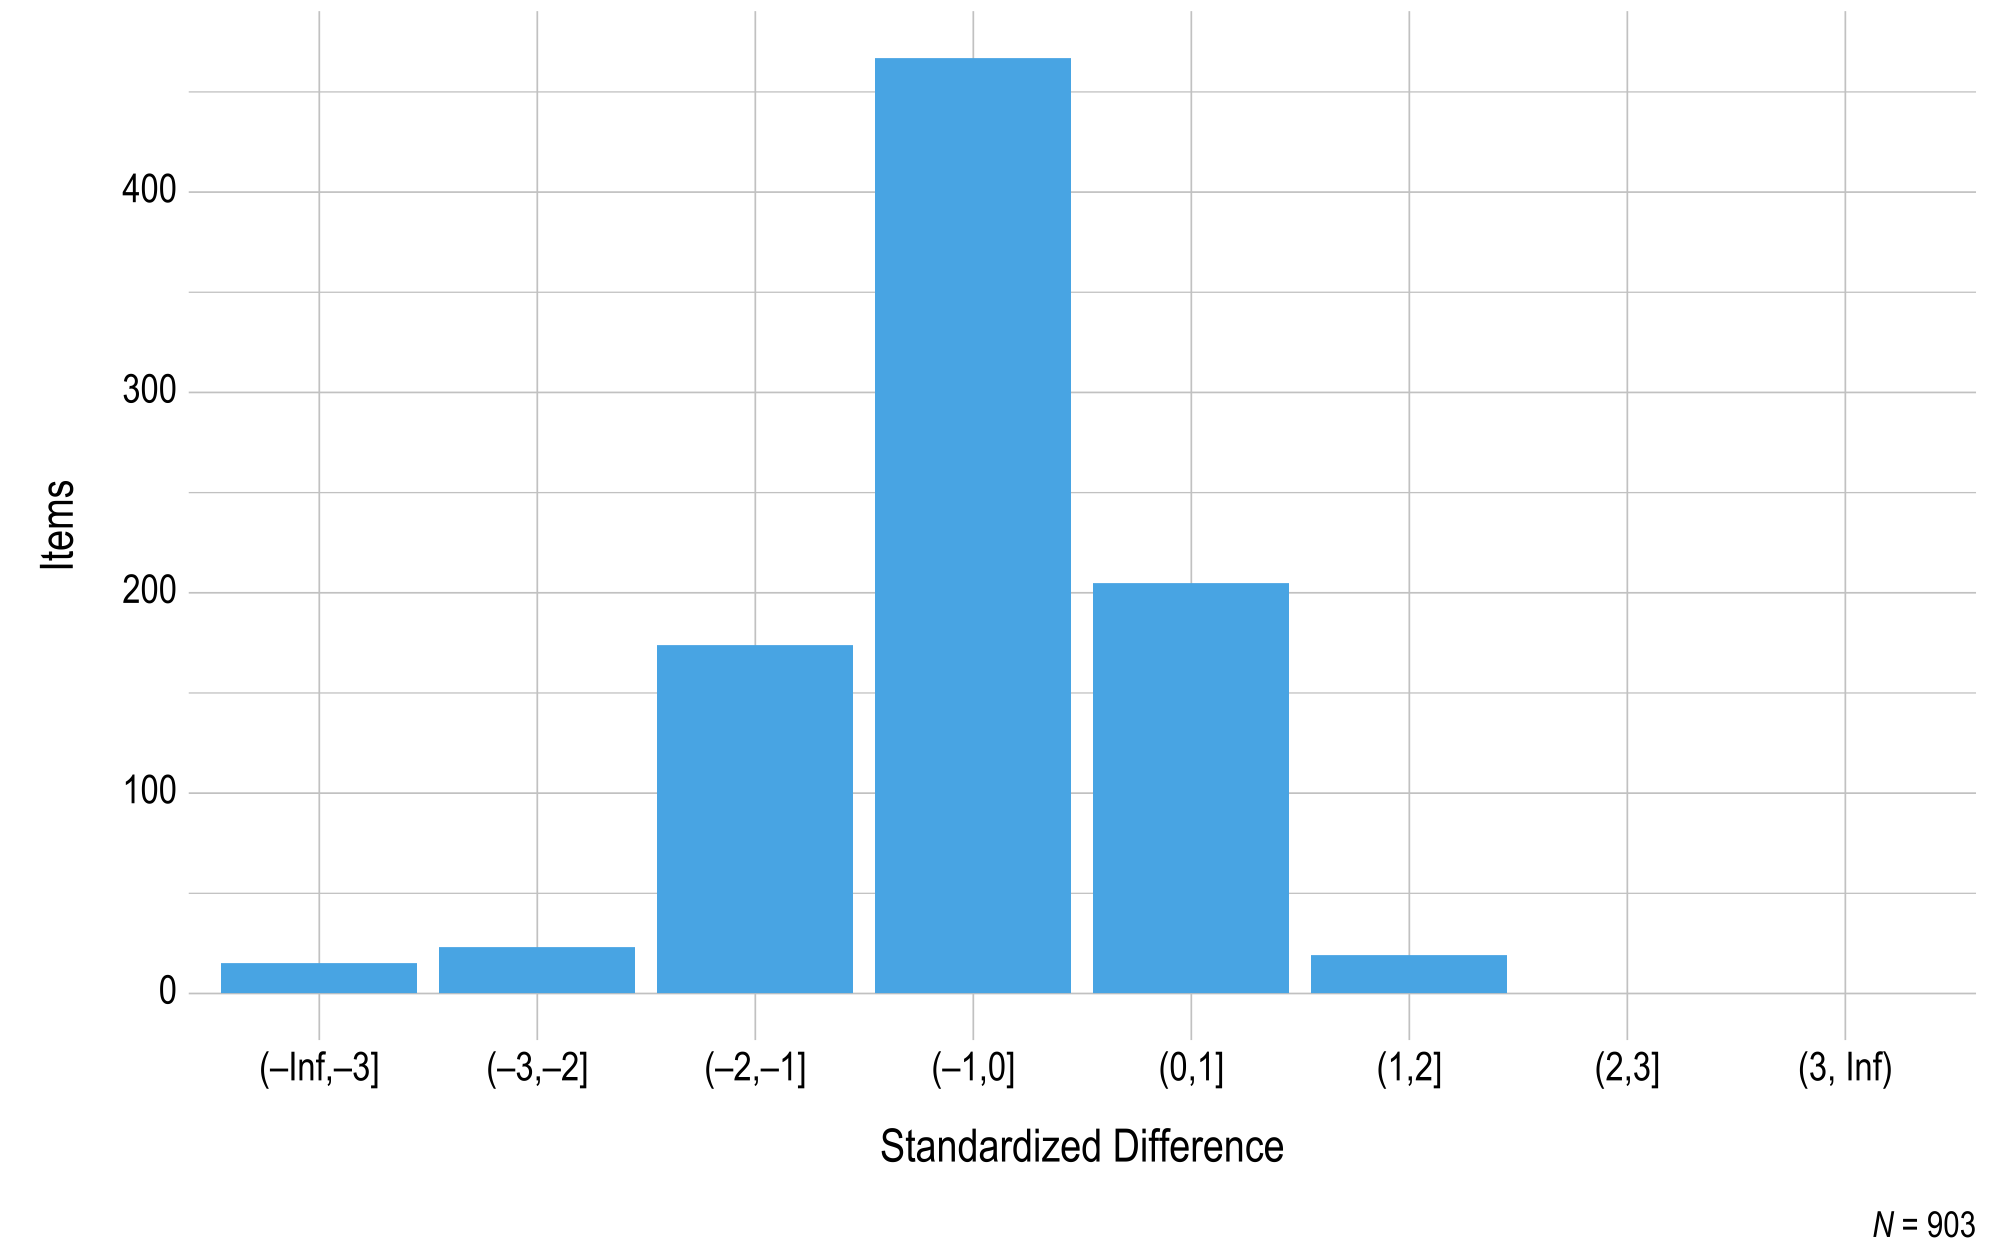
Note. Items with a sample size less than 20 were omitted.
A total of 57 ELA testlets (33%) and 83 mathematics testlets (42%) had at least one item flagged due to their p-value and/or standardized difference value. Test development teams reviewed all flagged items and their context within the testlet to identify possible reasons for the flag and to determine whether an edit was likely to resolve the issue.
Of the 115 ELA testlets that were not flagged, one (1%) was edited and reassigned to the field-test pool for content-based reasons (e.g., changes to item wording), 107 (93%) were promoted as is to the operational pool, six (5%) were sent back to the field-test pool with no edits for additional data collection to get estimates of item difficulty that are based on larger samples, and one (1%) was rejected and retired. Of the 57 ELA testlets that were flagged, five (9%) were edited and reassigned to the field-test pool and 52 (91%) were sent back to the field-test pool with no edits for additional data collection to get estimates of item difficulty that are based on larger samples. Of the 116 mathematics testlets that were not flagged, two (2%) were edited and reassigned to the field-test pool for content-based reasons, 90 (78%) were promoted as is to the operational pool, and 24 (21%) were rejected and retired. Of the 83 mathematics testlets that were flagged, nine (11%) were edited and reassigned to the field-test pool, 59 (71%) were promoted as is to the operational pool to maintain pool depth given testlet retirement, and 15 (18%) were rejected and retired.
In addition to these reviews, field-test items were reviewed for DIF following the same procedures for items in the operational pool (see Section 3.3.3 of this manual). A total of three field-test items in ELA and six field-test items in mathematics were flagged for nonnegligible DIF. Of the three ELA items that were reviewed by the test development team as part of their item review, one item was assigned to be edited and field-tested again and two items were sent back to the field-test pool with no edits. Of the six mathematics items that were reviewed by the test development team as part of their item review, six items were sent back to the field-test pool with no edits.
3.3.1.3 Field-Test Data Review
Data collected during each field test are compiled, and statistical flags are implemented ahead of test development team review. Flagging criteria serve as a source of evidence for test development teams in evaluating item quality; however, final judgments are content based, taking into account the testlet as a whole, the underlying nodes in the DLM maps that the items were written to assess, and pool depth.
Review of field-test data occurs annually during February and March. This review includes data from the immediately preceding fall and spring windows. That is, the review in February and March of 2023 includes field-test data collected during the spring 2022 window and the fall window of 2022–2023. Data that were collected during the 2023 spring window will be reviewed in February and March of 2024, with results included in the 2023–2024 technical manual update.
Test development teams for each subject classified each reviewed item into one of four categories:
- No changes made to item. Test development team decided item can go forward to operational assessment.
- Test development team identified concerns that required modifications. Modifications were clearly identifiable and were likely to improve item performance.
- Test development team identified concerns that required modifications. The content was worth preserving rather than rejecting. Item review may not have clearly pointed to specific modifications that were likely to improve the item.
- Rejected item. Test development team determined the item was not worth revising.
For an item to be accepted as is, the test development team had to determine that the item was consistent with DLM item-writing guidelines and that the item was aligned to the node. An item or testlet was rejected completely if it was inconsistent with DLM item-writing guidelines, if the EE and linkage level were covered by other testlets that had better-performing items, or if there was no clear content-based revision to improve the item. In some instances, a decision to reject an item resulted in the rejection of the testlet, as well.
Common reasons for flagging an item for modification included items that were misaligned to the node, distractors that could be argued as partially correct, or unnecessary complexity in the language of the stem. After reviewing flagged items, the test development team looked at all items classified into Category 3 or Category 4 within the testlet to help determine whether to retain or reject the testlet. Here, the test development team could elect to keep the testlet (with or without revision) or reject it. If a revision was needed, it was assumed the testlet needed field-testing again. The entire testlet was rejected if the test development team determined the flagged items could not be adequately revised.
3.3.2 Operational Assessment Items for 2022–2023
There were several updates to the pool of operational items for 2022–2023: 181 testlets were promoted to the operational pool from field-testing in 2021–2022, including 95 ELA testlets and 86 mathematics testlets. Additionally, six testlets (<1% of all testlets) were retired due to model fit. For a discussion of the model-based retirement process, see Chapter 5 of this manual.
Testlets were made available for operational testing in 2022–2023 based on the 2021–2022 operational pool and the promotion of testlets field-tested during 2021–2022 to the operational pool following their review. Table 3.19 summarizes the total number of operational testlets for 2022–2023. In total, there were 3,252 operational testlets available. This total included 608 EE/linkage level combinations (349 ELA, 259 mathematics) for which both a general version and a version for students who are blind or visually impaired or read braille were available.
Operational assessments were administered during the two instructionally embedded windows. A total of 365,850 test sessions were administered during both assessment windows. One test session is one testlet taken by one student. Only test sessions that were complete at the close of each testing window counted toward the total sessions.
|
Fall operational
|
Spring operational
|
|||
|---|---|---|---|---|
| Grade | English language arts (n) | Mathematics (n) | English language arts (n) | Mathematics (n) |
| 3 | 133 | 63 | 132 | 61 |
| 4 | 138 | 91 | 126 | 92 |
| 5 | 161 | 85 | 144 | 90 |
| 6 | 139 | 65 | 135 | 67 |
| 7 | 117 | 87 | 114 | 81 |
| 8 | 125 | 78 | 111 | 77 |
| 9–10 | 111 | 156 | 102 | 150 |
| 11–12 | 114 | * | 107 | * |
| * In mathematics, high school is banded in Grades 9–11. | ||||
3.3.2.1 Educator Perception of Assessment Content
Each year, test administrators are asked two questions about their perceptions of the assessment content; Participation in the test administrator survey is described in Chapter 4 of this manual. Table 3.20 describes their responses in 2022–2023. Questions pertained to whether the DLM assessments measured important academic skills and reflected high expectations for their students.
Test administrators generally responded that content reflected high expectations for their students (87% agreed or strongly agreed) and measured important academic skills (79% agreed or strongly agreed). While the majority of test administrators agreed with these statements, 13%–22% disagreed. DLM assessments represent a departure from the breadth of academic skills assessed by many states’ previous alternate assessments. Given the short history of general curriculum access for this population and the tendency to prioritize the instruction of functional academic skills (Karvonen et al., 2011), test administrators’ responses may reflect awareness that DLM assessments contain challenging content. However, test administrators were divided on its importance in the educational programs of students with the most significant cognitive disabilities. Feedback from focus groups with educators focusing on score reports and instructionally embedded assessment reflected similar variability in educator perceptions of assessment content (Clark et al., 2018, 2022).
|
Strongly
disagree |
Disagree
|
Agree
|
Strongly
agree |
|||||
|---|---|---|---|---|---|---|---|---|
| Statement | n | % | n | % | n | % | n | % |
| Content measured important academic skills and knowledge for this student. | 462 | 8.0 | 782 | 13.5 | 3,505 | 60.4 | 1,055 | 18.2 |
| Content reflected high expectations for this student. | 238 | 4.1 | 508 | 8.8 | 3,553 | 61.7 | 1,458 | 25.3 |
3.3.2.2 Psychometric Properties of Operational Assessment Items for 2022–2023
The proportion correct (p-value) was calculated for all operational items to summarize information about item difficulty.
Figure 3.5 and Figure 3.6 show the distribution of p-values for operational items in ELA and mathematics, respectively. To prevent items with small sample sizes from potentially skewing the results, the sample size cutoff for inclusion in the p-value plots was 20. In total, 472 items (4% of all items) were excluded due to small sample size, where 377 of the items were ELA items (6% of all ELA items) and 95 of the items were mathematics items (2% of all mathematics items). In general, ELA items were easier than mathematics items, as evidenced by the presence of more items in the higher bin (p-value) ranges.
Figure 3.5: p-values for English Language Arts 2022–2023 Operational Items
Note. Items with a sample size less than 20 were omitted.
Figure 3.6: p-values for Mathematics 2022–2023 Operational Items
Note. Items with a sample size less than 20 were omitted.
Items in the DLM assessments are designed and developed to be fungible (i.e., interchangeable) within each EE and linkage level, meaning that the items are expected to function identically to the other items measuring the same EE and linkage level. To evaluate the fungibility assumption, standardized difference values were calculated for all operational items, with a student sample size of at least 20 required to compare the p-value for the item to all other items measuring the same EE and linkage level. If an item is fungible with the other items measuring the same EE and linkage level, the item is expected to have a nonsignificant standardized difference value. The standardized difference values provide one source of evidence of internal consistency.
Figure 3.7 and Figure 3.8 summarize the distributions of standardized difference values for operational items in ELA and mathematics, respectively. Of all items measuring the EE and linkage level, 98% of ELA items and 99% of mathematics items fell within two standard deviations of the mean. As additional data are collected and decisions are made regarding item pool replenishment, test development teams will consider item standardized difference values, along with item misfit analyses, when determining which items and testlets are recommended for retirement.
Figure 3.7: Standardized Difference Z-Scores for English Language Arts 2022–2023 Operational Items
Note. Items with a sample size less than 20 were omitted.
Figure 3.8: Standardized Difference Z-Scores for Mathematics 2022–2023 Operational Items
Note. Items with a sample size less than 20 were omitted.
Figure 3.9 summarizes the distributions of standardized difference values for operational items by linkage level. Most items fell within two standard deviations of the mean of all items measuring the respective EE and linkage level, and the distributions are consistent across linkage levels.
Figure 3.9: Standardized Difference Z-Scores for 2022–2023 Operational Items by Linkage Level
Note. Items with a sample size less than 20 were omitted.
3.3.3 Evaluation of Item-Level Bias
DIF identifies instances where test items are more difficult for some groups of examinees despite these examinees having similar knowledge and understanding of the assessed concepts (Camilli & Shepard, 1994). DIF analyses can uncover internal inconsistency if particular items are functioning differently in a systematic way for identifiable subgroups of students (American Educational Research Association et al., 2014). While identification of DIF does not always indicate a weakness in the test item, it can point to construct-irrelevant variance, posing considerations for validity and fairness.
3.3.3.1 Method
DIF analyses followed the same procedure used in previous years and examined race in addition to gender. Analyses included data from 2015–2016 through 2021–2022 DIF analyses are conducted on the sample of data used to update the model calibration, which uses data through the previous operational assessment. See Chapter 5 of this manual for more information. to flag items for evidence of DIF. Items were selected for inclusion in the DIF analyses based on minimum sample-size requirements for the three gender subgroups (female, male, and nonbinary/undesignated) and for race subgroups: African American, Alaska Native, American Indian, Asian, multiple races, Native Hawaiian or Pacific Islander, and White.
The DLM student population is unbalanced in both gender and race. The number of female students responding to items is smaller than the number of male students by a ratio of approximately 1:2, and nonbinary/undesignated students make up less than 0.1% of the DLM student population. Similarly, the number of non-White students responding to items is smaller than the number of White students by a ratio of approximately 1:2. Therefore, on advice from the DLM Technical Advisory Committee, the threshold for including an item in DIF analysis requires that the focal group (i.e., the historically disadvantaged group) must have at least 100 students responding to the item. The threshold of 100 was selected to balance the need for a sufficient sample size in the focal group with the relatively low number of students responding to many DLM items. Writing items were excluded from the DIF analyses described here because they include nonindependent response options.
Consistent with previous years, additional criteria were included to prevent estimation errors. Items with an overall proportion correct (p-value) greater than .95 or less than .05 were removed from the analyses. Items for which the p-value for one gender or racial group was greater than .97 or less than .03 were also removed from the analyses.
For each item, logistic regression was used to predict the probability of a correct response, given group membership and performance in the subject. Specifically, the logistic regression equation for each item included a matching variable comprised of the student’s total linkage levels mastered in the subject of the item and a group membership variable, with the reference group (i.e., males for gender, White for race) coded as 1 and the focal group (i.e., females or nonbinary/undesignated for gender; African American, Asian, American Indian, Native Hawaiian or Pacific Islander, Alaska Native, or two or more races for race) coded as 0. An interaction term was included to evaluate whether nonuniform DIF was present for each item (Swaminathan & Rogers, 1990); the presence of nonuniform DIF indicates that the item functions differently because of the interaction between total linkage levels mastered and the student’s group (i.e., gender or racial group). When nonuniform DIF is present, the group with the highest probability of a correct response to the item differs along the range of total linkage levels mastered; thus, one group is favored at the low end of the spectrum and the other group is favored at the high end.
Three logistic regression models were fitted for each item:
\[\begin{align} \text{M}_0\text{: } \text{logit}(\pi_i) &= \beta_0 + \beta_1\text{X} \tag{3.1} \\ \text{M}_1\text{: } \text{logit}(\pi_i) &= \beta_0 + \beta_1\text{X} + \beta_2G \tag{3.2} \\ \text{M}_2\text{: } \text{logit}(\pi_i) &= \beta_0 + \beta_1\text{X} + \beta_2G + \beta_3\text{X}G\tag{3.3} \end{align}\]where \(\pi_i\) is the probability of a correct response to item i, \(\text{X}\) is the matching criterion, \(G\) is a dummy coded grouping variable (0 = reference group, 1 = focal group), \(\beta_0\) is the intercept, \(\beta_1\) is the slope, \(\beta_2\) is the group-specific parameter, and \(\beta_3\) is the interaction term.
Because of the number of items evaluated for DIF, Type I error rates were susceptible to inflation. The incorporation of an effect-size measure can be used to distinguish practical significance from statistical significance by providing a metric of the magnitude of the effect of adding group and interaction terms to the regression model.
For each item, the change in the Nagelkerke pseudo \(R^2\) measure of effect size was captured, from \(M_0\) to \(M_1\) or \(M_2\), to account for the effect of the addition of the group and interaction terms to the equation. All effect-size values were reported using both the Zumbo and Thomas (1997) and Jodoin and Gierl (2001) indices for reflecting a negligible (also called A-level DIF), moderate (B-level DIF), or large effect (C-level DIF). The Zumbo and Thomas thresholds for classifying DIF effect size are based on Cohen’s (1992) guidelines for identifying a small, medium, or large effect. The thresholds for each level are .13 and .26; values less than .13 have a negligible effect, values between .13 and .26 have a moderate effect, and values of .26 or greater have a large effect. The Jodoin and Gierl thresholds are more stringent, with lower threshold values of .035 and .07 to distinguish between negligible, moderate, and large effects.
3.3.3.2 DIF Results
Using the above criteria for inclusion, 6,412 (59%) items were selected for at least one gender group comparison, and 4,606 (43%) items were selected for at least one racial group comparison. The number of items evaluated by grade and subject for gender ranged from 43 in grades 9–10 ELA to 545 in grades 9–10 mathematics. Because students taking DLM assessments represent three possible gender groups, there are up to two comparisons that can be made for each item, with the male group as the reference group and each of the other two groups (i.e., female, nonbinary/undesignated) as the focal group. Across all items, this results in 21,638 possible comparisons. Using the inclusion criteria specified above, 6,412 (30%) item and focal group comparisons were selected for analysis. All 6,412 items were evaluated for the female focal group. The number of items evaluated by grade and subject for race ranged from 39 in grades 9–10 ELA to 402 in grades 9–10 mathematics. Because students taking DLM assessments represent seven possible racial groups, See Chapter 7 of this manual for a summary of participation by race and other demographic variables. there are up to six comparisons that can be made for each item, with the White group as the reference group and each of the other six groups (i.e., African American, Asian, American Indian, Native Hawaiian or Pacific Islander, Alaska Native, two or more races) as the focal group. Across all items, this results in 64,914 possible comparisons. Using the inclusion criteria specified above, 9,387 (14%) item and focal group comparisons were selected for analysis. Overall, 1,913 items were evaluated for one racial focal group, 1,271 items were evaluated for two racial focal groups, 756 items were evaluated for three racial focal groups, and 666 items were evaluated for four racial focal groups. One racial focal group and the White reference group were used in each comparison. Table 3.21 shows the number of items that were evaluated for each racial focal group. Across all gender and race comparisons, sample sizes for each comparison ranged from 237 to 12,525 for gender and from 398 to 10,333 for race.
| Focal group | Items (n) |
|---|---|
| African American | 4,604 |
| American Indian | 671 |
| Asian | 1,417 |
| Two or more races | 2,695 |
Table 3.22 and Table 3.23 show the number and percentage of subgroup combinations that did not meet each inclusion criteria for gender and race, respectively, by subject and the linkage level the items assess. A total of 4,407 items were not included in the DIF analysis for gender for any of the subgroups. Of the 15,226 item and focal group comparisons that were not included in the DIF analysis for gender, 14,850 (98%) had a focal group sample size of less than 100, 124 (1%) had an item p-value greater than .95, and 252 (2%) had a subgroup p-value greater than .97. A total of 6,213 items were not included in the DIF analysis for race for any of the subgroups. Of the 55,527 item and focal group comparisons that were not included in the DIF analysis for race, 54,894 (99%) had a focal group sample size of less than 100, 198 (<1%) had an item p-value greater than .95, and 435 (1%) had a subgroup p-value greater than .97. The majority of nonincluded comparisons come from ELA for both gender (n = 9,199; 60%) and race (n = 33,167; 60%).
|
Sample
size |
Item
proportion correct |
Subgroup
proportion correct |
||||
|---|---|---|---|---|---|---|
| Subject and linkage level | n | % | n | % | n | % |
| English language arts | ||||||
| Initial Precursor | 1,800 | 20.2 | 0 | 0.0 | 0 | 0.0 |
| Distal Precursor | 1,956 | 21.9 | 0 | 0.0 | 26 | 13.4 |
| Proximal Precursor | 1,852 | 20.8 | 5 | 6.0 | 79 | 40.7 |
| Target | 1,542 | 17.3 | 27 | 32.5 | 61 | 31.4 |
| Successor | 1,772 | 19.9 | 51 | 61.4 | 28 | 14.4 |
| Mathematics | ||||||
| Initial Precursor | 1,126 | 19.0 | 0 | 0.0 | 0 | 0.0 |
| Distal Precursor | 956 | 16.1 | 0 | 0.0 | 8 | 13.8 |
| Proximal Precursor | 1,107 | 18.7 | 21 | 51.2 | 20 | 34.5 |
| Target | 1,294 | 21.8 | 13 | 31.7 | 27 | 46.6 |
| Successor | 1,445 | 24.4 | 7 | 17.1 | 3 | 5.2 |
|
Sample
size |
Item
proportion correct |
Subgroup
proportion correct |
||||
|---|---|---|---|---|---|---|
| Subject and linkage level | n | % | n | % | n | % |
| English language arts | ||||||
| Initial Precursor | 6,962 | 21.2 | 0 | 0.0 | 1 | 0.4 |
| Distal Precursor | 7,526 | 23.0 | 0 | 0.0 | 36 | 13.7 |
| Proximal Precursor | 7,180 | 21.9 | 1 | 0.8 | 96 | 36.5 |
| Target | 5,477 | 16.7 | 29 | 22.1 | 49 | 18.6 |
| Successor | 5,628 | 17.2 | 101 | 77.1 | 81 | 30.8 |
| Mathematics | ||||||
| Initial Precursor | 4,504 | 20.4 | 0 | 0.0 | 0 | 0.0 |
| Distal Precursor | 3,791 | 17.1 | 0 | 0.0 | 24 | 14.0 |
| Proximal Precursor | 4,427 | 20.0 | 43 | 64.2 | 41 | 23.8 |
| Target | 4,803 | 21.7 | 15 | 22.4 | 56 | 32.6 |
| Successor | 4,596 | 20.8 | 9 | 13.4 | 51 | 29.7 |
3.3.3.2.1 Uniform Differential Item Functioning Model
A total of 694 items for gender were flagged for evidence of uniform DIF. Additionally, 1,086 item and focal group combinations across 931 items for race were flagged for evidence of uniform DIF. Table 3.24 and Table 3.25 summarize the total number of combinations flagged for evidence of uniform DIF by subject and grade for gender and race, respectively. The percentage of combinations flagged for uniform DIF ranged from 6% to 15% for gender and from 8% to 21% for race.
| Grade | Items flagged (n) | Total items (N) | Items flagged (%) | Items with moderate or large effect size (n) |
|---|---|---|---|---|
| English language arts | ||||
| 3 | 28 | 406 | 6.9 | 0 |
| 4 | 43 | 445 | 9.7 | 0 |
| 5 | 47 | 458 | 10.3 | 0 |
| 6 | 63 | 506 | 12.5 | 0 |
| 7 | 35 | 450 | 7.8 | 0 |
| 8 | 43 | 445 | 9.7 | 0 |
| 10 | 6 | 39 | 15.4 | 0 |
| 11 | 27 | 183 | 14.8 | 0 |
| 9–10 | 41 | 306 | 13.4 | 0 |
| 11–12 | 11 | 171 | 6.4 | 0 |
| Mathematics | ||||
| 3 | 35 | 311 | 11.3 | 0 |
| 4 | 61 | 418 | 14.6 | 0 |
| 5 | 39 | 416 | 9.4 | 0 |
| 6 | 36 | 307 | 11.7 | 0 |
| 7 | 54 | 369 | 14.6 | 0 |
| 8 | 43 | 370 | 11.6 | 0 |
| 9 | 18 | 260 | 6.9 | 0 |
| 10 | 28 | 285 | 9.8 | 0 |
| 11 | 36 | 263 | 13.7 | 2 |
| Grade | Items flagged (n) | Total items (N) | Items flagged (%) | Items with moderate or large effect size (n) |
|---|---|---|---|---|
| English language arts | ||||
| 3 | 73 | 578 | 12.6 | 0 |
| 4 | 79 | 671 | 11.8 | 0 |
| 5 | 63 | 626 | 10.1 | 0 |
| 6 | 57 | 614 | 9.3 | 0 |
| 7 | 75 | 619 | 12.1 | 0 |
| 8 | 70 | 571 | 12.3 | 0 |
| 10 | 11 | 80 | 13.8 | 0 |
| 11 | 57 | 429 | 13.3 | 0 |
| 9–10 | 84 | 397 | 21.2 | 0 |
| 11–12 | 7 | 84 | 8.3 | 0 |
| Mathematics | ||||
| 3 | 68 | 556 | 12.2 | 0 |
| 4 | 65 | 695 | 9.4 | 0 |
| 5 | 65 | 696 | 9.3 | 0 |
| 6 | 70 | 592 | 11.8 | 0 |
| 7 | 66 | 524 | 12.6 | 0 |
| 8 | 89 | 650 | 13.7 | 0 |
| 9 | 29 | 370 | 7.8 | 0 |
| 10 | 27 | 290 | 9.3 | 0 |
| 11 | 31 | 345 | 9.0 | 0 |
For gender, using the Zumbo and Thomas (1997) effect-size classification criteria, all combinations were found to have a negligible effect-size change after the gender term was added to the regression equation. When using the Jodoin and Gierl (2001) effect-size classification criteria, all but two combinations were found to have a negligible effect-size change after the gender term was added to the regression equation.
The results of the DIF analyses for race were similar to those for gender. When using the Zumbo and Thomas (1997) effect-size classification criteria, all combinations were found to have a negligible effect-size change after the race term was added to the regression equation. Similarly, when using the Jodoin and Gierl (2001) effect-size classification criteria, all combinations were found to have a negligible effect-size change after the race term was added to the regression equation.
Table 3.26 provides information about the flagged items with a nonnegligible effect-size change after the addition of the group term, as represented by a value of B (moderate) or C (large). The test development team reviews all items flagged with a moderate or large effect size. The \(\beta_2G\) values (i.e., the coefficients for the group term) in Table 3.26 indicate which group was favored on the item after accounting for total linkage levels mastered, with positive values indicating that the focal group had a higher probability of success on the item and negative values indicating that the focal group had a lower probability of success on the item. The focal group was favored on none of the combinations.
| Item ID | Focal | Grade | EE | \(\chi^2\) | \(p\)-value | \(\beta_2G\) | \(R^2\) | Z&T* | J&G* | Window |
|---|---|---|---|---|---|---|---|---|---|---|
| Mathematics | ||||||||||
| 39090 | Female | 11 | M.EE.HS.F.BF.2 | 8.43 | .004 | −0.93 | .042 | A | B | Fall |
| 60583 | Female | 11 | M.EE.HS.F.IF.1-3 | 9.07 | .003 | −0.75 | .039 | A | B | Fall |
| Note. EE = Essential Element; \(\beta_2G\) = the coefficient for the group term (Equation (3.3)); Z&T = Zumbo & Thomas; J&G = Jodoin & Gierl. | ||||||||||
| * Effect-size measure: A indicates evidence of negligible DIF, B indicates evidence of moderate DIF, and C indicates evidence of large DIF. | ||||||||||
3.3.3.2.2 Nonuniform Differential Item Functioning Model
A total of 859 items were flagged for evidence of nonuniform DIF. Additionally, 1,264 item and focal group combinations across 1,068 items were flagged for evidence of nonuniform DIF when both the race and interaction terms were included in the regression equation. Table 3.27 and Table 3.28 summarize the number of combinations flagged by subject and grade. The percentage of combinations flagged ranged from 8% to 19% for gender and from 10% to 19% for race.
| Grade | Items flagged (n) | Total items (N) | Items flagged (%) | Items with moderate or large effect size (n) |
|---|---|---|---|---|
| English language arts | ||||
| 3 | 31 | 406 | 7.6 | 1 |
| 4 | 58 | 445 | 13.0 | 2 |
| 5 | 56 | 458 | 12.2 | 1 |
| 6 | 78 | 506 | 15.4 | 9 |
| 7 | 46 | 450 | 10.2 | 2 |
| 8 | 51 | 445 | 11.5 | 1 |
| 10 | 6 | 39 | 15.4 | 0 |
| 11 | 30 | 183 | 16.4 | 0 |
| 9–10 | 35 | 306 | 11.4 | 0 |
| 11–12 | 28 | 171 | 16.4 | 1 |
| Mathematics | ||||
| 3 | 41 | 311 | 13.2 | 0 |
| 4 | 81 | 418 | 19.4 | 0 |
| 5 | 49 | 416 | 11.8 | 0 |
| 6 | 45 | 307 | 14.7 | 0 |
| 7 | 66 | 369 | 17.9 | 0 |
| 8 | 49 | 370 | 13.2 | 0 |
| 9 | 32 | 260 | 12.3 | 1 |
| 10 | 33 | 285 | 11.6 | 0 |
| 11 | 44 | 263 | 16.7 | 4 |
| Grade | Items flagged (n) | Total items (N) | Items flagged (%) | Items with moderate or large effect size (n) |
|---|---|---|---|---|
| English language arts | ||||
| 3 | 66 | 578 | 11.4 | 0 |
| 4 | 84 | 671 | 12.5 | 0 |
| 5 | 93 | 626 | 14.9 | 0 |
| 6 | 72 | 614 | 11.7 | 1 |
| 7 | 75 | 619 | 12.1 | 0 |
| 8 | 73 | 571 | 12.8 | 1 |
| 10 | 9 | 80 | 11.2 | 0 |
| 11 | 66 | 429 | 15.4 | 0 |
| 9–10 | 77 | 397 | 19.4 | 0 |
| 11–12 | 13 | 84 | 15.5 | 0 |
| Mathematics | ||||
| 3 | 68 | 556 | 12.2 | 0 |
| 4 | 98 | 695 | 14.1 | 0 |
| 5 | 70 | 696 | 10.1 | 0 |
| 6 | 79 | 592 | 13.3 | 1 |
| 7 | 101 | 524 | 19.3 | 0 |
| 8 | 111 | 650 | 17.1 | 0 |
| 9 | 37 | 370 | 10.0 | 0 |
| 10 | 33 | 290 | 11.4 | 0 |
| 11 | 39 | 345 | 11.3 | 0 |
Using the Zumbo and Thomas (1997) effect-size classification criteria, all combinations were found to have a negligible effect-size change after the gender and interaction terms were added to the regression equation. When using the Jodoin and Gierl (2001) effect-size classification criteria, all but 22 combinations were found to have a negligible effect-size change after the gender and interaction terms were added to the regression equation.
The results of the DIF analyses for race were similar to those for gender. When using the Zumbo and Thomas (1997) effect-size classification criteria, all but one combination were found to have a negligible effect-size change after the race and interaction terms were added to the regression equation. Similarly, when using the Jodoin and Gierl (2001) effect-size classification criteria, all but three combinations were found to have a negligible effect-size change after the race and interaction terms were added to the regression equation.
Information about the flagged items with a nonnegligible change in effect size after adding both the group and interaction term is summarized in Table 3.29, where B indicates a moderate effect size and C a large effect size. The test development team reviews all items flagged with a moderate or large effect size. In total, 24 combinations had a moderate effect size and one combination had a large effect size. The \(\beta_3\text{X}G\) values in Table 3.29 indicate which group was favored at lower and higher numbers of linkage levels mastered. A total of 13 combinations favored the focal group at higher numbers of total linkage levels mastered and the reference group at lower numbers of total linkage levels mastered.
| Item ID | Focal | Grade | EE | \(\chi^2\) | \(p\)-value | \(\beta_2G\) | \(\beta_3\text{X}G\) | \(R^2\) | Z&T* | J&G* | Window |
|---|---|---|---|---|---|---|---|---|---|---|---|
| English language arts | |||||||||||
| 10183 | Female | 3 | ELA.EE.RL.3.2 | 8.87 | .012 | 0.49 | 0.07 | .039 | A | B | Spring |
| 14820 | Female | 4 | ELA.EE.RL.4.5 | 23.37 | <.001 | 2.68 | −0.19 | .043 | A | B | Fall |
| 40993 | Female | 4 | ELA.EE.RL.4.1 | 10.80 | .005 | −1.16 | 0.25 | .044 | A | B | Fall |
| 38067 | Female | 5 | ELA.EE.RI.5.9 | 9.46 | .009 | 0.21 | −0.03 | .040 | A | B | Fall |
| 15633 | Female | 6 | ELA.EE.RL.6.1 | 9.78 | .008 | −0.09 | −0.06 | .035 | A | B | Spring |
| 15635 | Female | 6 | ELA.EE.RL.6.1 | 10.51 | .005 | −1.34 | 0.05 | .036 | A | B | Spring |
| 38765 | Female | 6 | ELA.EE.RI.6.8 | 9.11 | .011 | 0.25 | −0.05 | .037 | A | B | Fall |
| 38989 | Female | 6 | ELA.EE.RI.6.1 | 21.21 | <.001 | 0.39 | −0.19 | .041 | A | B | Fall |
| 39755 | Female | 6 | ELA.EE.RL.6.6 | 18.78 | <.001 | −1.60 | 0.27 | .063 | A | B | Fall |
| 39766 | Female | 6 | ELA.EE.RL.6.6 | 17.26 | <.001 | 0.88 | −0.28 | .046 | A | B | Spring |
| 39774 | Female | 6 | ELA.EE.RL.6.6 | 23.15 | <.001 | −1.93 | 0.43 | .057 | A | B | Spring |
| 46941 | Female | 6 | ELA.EE.RI.6.3 | 9.62 | .008 | −1.39 | 0.06 | .040 | A | B | Fall |
| 55611 | Female | 6 | ELA.EE.RL.6.4 | 11.05 | .004 | −1.32 | 0.20 | .036 | A | B | Fall |
| 37622 | African American | 6 | ELA.EE.RL.6.5 | 25.52 | <.001 | 0.85 | −0.17 | .035 | A | B | Fall |
| 33860 | Female | 7 | ELA.EE.RL.7.5 | 11.30 | .004 | −1.23 | 0.06 | .050 | A | B | Fall |
| 35161 | Female | 7 | ELA.EE.RI.7.4 | 12.64 | .002 | −0.86 | 0.10 | .037 | A | B | Spring |
| 56991 | Female | 8 | ELA.EE.RI.8.5 | 9.91 | .007 | 3.19 | −0.09 | .039 | A | B | Spring |
| 54118 | Asian | 8 | ELA.EE.RL.8.3 | 10.74 | .005 | 0.52 | −0.05 | .747 | C | C | Spring |
| 37562 | Female | 11–12 | ELA.EE.RI.11-12.3 | 24.19 | <.001 | −1.87 | 0.04 | .038 | A | B | Spring |
| Mathematics | |||||||||||
| 44250 | African American | 6 | M.EE.6.NS.3 | 19.68 | <.001 | −0.61 | 0.39 | .039 | A | B | Fall |
| 41683 | Female | 9 | M.EE.HS.N.CN.2.a | 10.54 | .005 | −1.73 | 0.08 | .036 | A | B | Fall |
| 39090 | Female | 11 | M.EE.HS.F.BF.2 | 9.07 | .011 | −0.34 | −0.04 | .045 | A | B | Fall |
| 60583 | Female | 11 | M.EE.HS.F.IF.1-3 | 9.07 | .011 | −0.77 | 0.00 | .039 | A | B | Fall |
| 70599 | Female | 11 | M.EE.HS.A.SSE.4 | 18.82 | <.001 | 1.21 | −0.36 | .057 | A | B | Fall |
| 70601 | Female | 11 | M.EE.HS.A.SSE.4 | 14.18 | <.001 | 1.28 | −0.31 | .038 | A | B | Fall |
| Note. EE = Essential Element; \(\beta_2G\) = the coefficient for the group term (Equation (3.3)); Z&T = Zumbo & Thomas; J&G = Jodoin & Gierl. | |||||||||||
| * Effect-size measure: A indicates evidence of negligible DIF, B indicates evidence of moderate DIF, and C indicates evidence of large DIF. | |||||||||||
3.4 Conclusion
During 2022–2023, the test development teams conducted virtual events for both item writing and external review. Overall, 398 testlets were written for ELA and mathematics. Additionally, 30 new texts were written for ELA. Following external review, the test development team retained 72% and 40% of ELA and mathematics testlets, respectively. The test development team also retained 10% of the developed ELA texts. Of the content already in the operational pool, most items had p-values within two standard deviations of the mean for the EE and linkage level, two items were flagged for nonnegligible uniform DIF, and 25 items were flagged for nonnegligible nonuniform DIF. Field-testing in 2022–2023 focused on collecting data to refresh the operational pool of testlets.